Translate this page into:
Forecasting of Malaria in India using Time series analysis
Corresponding author: _Dr. Muthukumar T. Assistant Professor, Department of Community Medicine, Shri Sathya Sai Medical College and Research Institution,Ammapettai, Kancheepuram dist. Ph: +91- 9442029340 Mail: muthu.spartans@gmail.com
How to cite this article: Muthukumar T, Karnaboopathy R, Annadurai K, Raja TK. Forecasting of Malaria in India using Time series analysis J Comprehensive Health 2019;7(2): 16-22.
Abstract
Background:
Although there has been marked reduction in the number of malaria cases in India under National Vector Borne Disease Control Programme (NVBDCP), malaria still is the leading cause of infectious diseases with the development of drug resistant Plasmodium species and insecticide resistant mosquitoes. Keeping this in view, the present study attempts to forecast the malaria cases in India.
Methods:
We adopted an Auto Regressive Integrated Moving Average (ARIMA) models on the data collected on the number of malaria cases from 1990 to 2017. The same has been used to predict the number of cases till 2025 without any additional intervention.
Results:
The results also showed a decreasing trend in the actual and forecasted numbers of malaria cases. The appropriate ARIMA (10, 1, 9) model was selected based on Bayesian Information Criteria (BIC) values.
Conclusions:
Hence, to achieve the target of Sustainable Developmental Goal by 2030, additional interventions with an increase in the intensity of existing interventions and support of the international community along with WHO is essential.
Keywords
Univariate time series
Malaria
ARIMA
BIC
Forecasting

Introduction:
World Health Organization (WHO) has highlighted the serious and increasing threat of vector-borne diseases with the theme "Preventing vector-borne diseases" and also with the slogan "Small bite, big threat" for the year 2014. Among vector borne diseases, malaria poses the biggest threat with about 40% of the world's population at risk of infection. In 2013, 97 countries had ongoing transmission of malaria.1 Malaria decreases economic growth by more than one percentage point per year in endemic countries. Malaria is a life-threatening blood disease caused by a parasite that is transmitted to humans by the Anopheles mosquito. Out of 400 species of anopheline mosquitoes throughout the world, only 60 species are vectors of malaria. Whereas, in India 45 anopheline species have been reported, out of which 9 species are malarial vectors. Malaria imposes great socio-economic burden on humanity and about 36 per cent of the world population, i.e. 2020 million is exposed to the risk of contracting malaria in approximately 90 countries. World Health Organization estimates 300-500 million malaria cases annually worldwide.2 Unlike Africa, where most of the deaths are reported in infants and children, in India, it is seen that malarial mortality is maximum in the economically productive age groups of 15 to 44 years.3 A malaria-stricken family spends an average of over one quarter of its income on malaria treatment, as well as paying prevention costs and suffering loss of income.4 Due to the severe health impact of malaria, there is a growing need for methods that will allow forecasting and early warning with timely case detection in areas of unstable transmission, so that more control measures can be implemented effectively.5 In India, National Vector Borne Disease Control Programme (NVBDCP) reported around 0.8 million cases of malaria in India in 2017 and there were about 104 deaths, of which 40-50 % of the cases is due to Plasmodium falciparum. Malaria can be cured by effective treatment at its early stages.
Even a century after the discovery of malaria transmission through mosquitoes in India by Sir Ronald Ross in 1897, malaria continues to be one of India's leading public health problems. In the 1930's, a treatise written by Sinton6 on 'what malaria costs India recorded that the problem of the very existence in many parts of India was in fact the problem of malaria. There is an increase in the availability of Medical staff over the years. With the improvement in all such facilities, malaria cases will have to be decreased and ultimately we can expect this disease to be eliminated from India like the Polio. Although there has been marked reduction in the number of malaria cases in India under National Vector Borne Disease Control Programme (NVBDCP), malaria still is the leading cause of infectious diseases with the development of drug resistant Plasmodium species and insecticide resistant mosquitoes. Keeping this in view, the present study attempts to forecast the malaria cases in India.
Methodology:
Study Design:
Analytical cross sectional study
Data Collection:
The present study is based on data regarding malaria cases in India from National vector borne disease control program (NVBDC).7 The present study attempts to find out the trend for number of malaria cases in India and tries to forecast for future periods. Auto regressive integrated moving average (ARIMA) model was fitted with the data available during 1990 to 2017. In 1968, George Box and Gwilym Jenkins have broadly studied ARIMA models and their names have frequently been used synonymously with general ARIMA process applied to time series analysis, forecasting and control.8
Autoregressive (AR) models can be effectively joined with Moving Average (MA) models to form a general and useful class of time series models called Autoregressive Moving Average ARMA (p, q) models. However, they can only be used when the data are stationary. When a time series is studied based on the confidence relationship between the time- lagged values of the forecast variance and the past error terms, an Autoregressive Integrated Moving Average (ARIMA) model is more suitable and it can be used when the time series is non-stationary.
The general form of the ARIMA (p, d, q) model is,
Yt = α + α1 Yt-1 + α2 Yt-2+ ... αpYt-p + β1et-2 + ... βqet-q + et
Where Yt and et are actual and random error at time period t, respectively; p, d and q represent the order of autoregressive part, the degree of differencing involved and the order of the moving average part. Random error, et independently and identically distributed (i. i. d) random variable with mean zero and variance (σ2).9-11
Generally, ARIMA models consist of four stages:
Identification of the model: This involves selecting the most appropriate lags for the AR and MA parts, as well as determining if the variable requires first-differencing to induce stationary. The Auto Correlation Function (ACF) and Partial Auto Correlation Function (PACF) are used to identify the best model.
Estimation: This usually involves the use of a least squares estimation process.
Diagnostic testing: This usually is the test for autocorrelation. If this part fails, then the process returns back to the identification section and begins again, usually by the addition of extra variables.
Forecasting: The ARIMA models are particularly useful for forecasting due to the use of lagged variables.
An ARIMA model can be obtained at first by determining its parameters. The values of p and q can be determined from the patterns in the plotting of the values of ACF and PACF. The spikes falling above the time axis are used to estimate the value of p. The spikes falling below the time axis are used to estimate the value of q. For an AR (p) model, the spikes of ACF decay exponentially or there is a sine wave pattern and the spikes of PACF are close to zero beyond the time lag p. For a MA (q) model the spikes on the ACF end to zero beyond the time lag q whereas the spikes of PACF decay exponentially or there is a sine wave pattern.(12,13).
Once the model was identified and model parameter can be estimated, then the model is determined with a different set of parameters. It is basically checked with the assumption that the model about the random error et is satisfied. This can be identified as several diagnostic statistical measures and plots of the residuals can be used to examine the goodness of fit of different models to the historical data. The model selection can be made based on the values of certain criteria like Normalized Bayesian Information Criteria (BIC).
Statistical analysis:
The data on malaria cases were entered in MS excel and the time series analysis was done using SPSS Version 23.0 software on 27 years previous data on number of malaria cases in India to forecast the malaria cases till 2025.
Results:
Data regarding the number of malaria cases in India from 1990 to 2017 was collected from National vector borne disease control program (NVBDC). This data were plotted on a graph to see the trend in individual country (Figure 1).
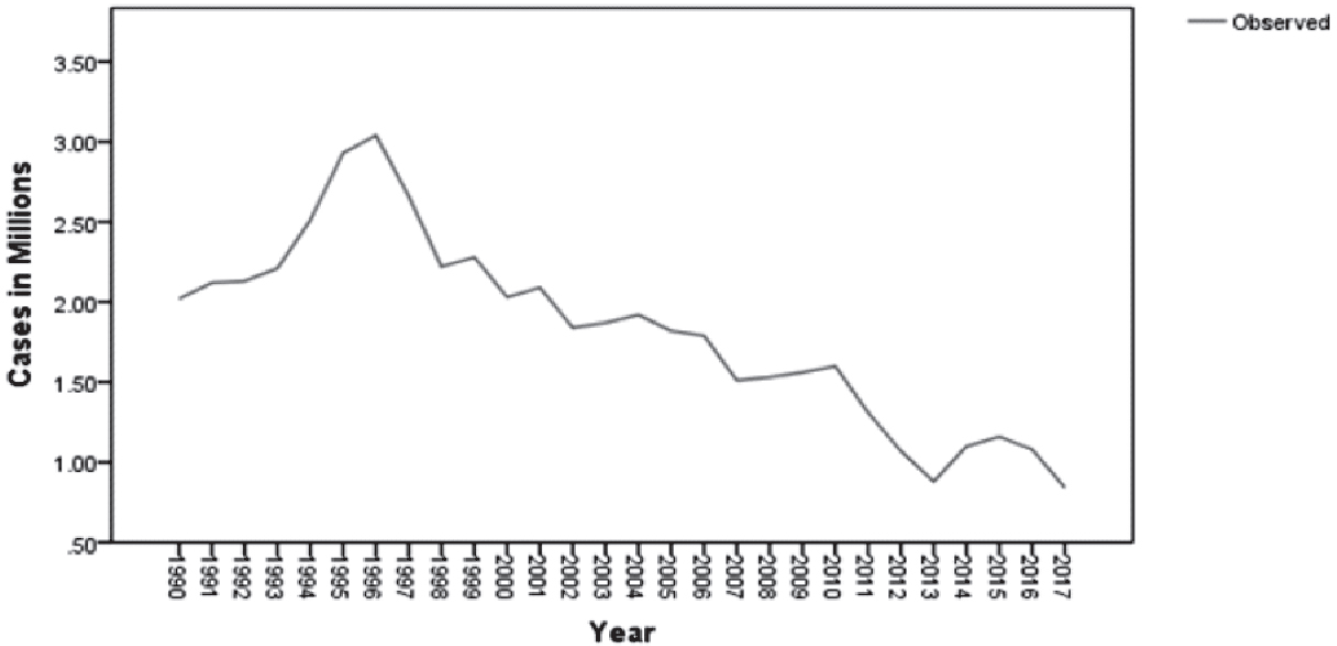
- No. of malaria cases during the period of 1990-2017
Auto Correlation Function (Figure 2) and Partial Auto Correlation Function (Figure 3) showed that an irregular increasing pattern in the number of malaria cases.
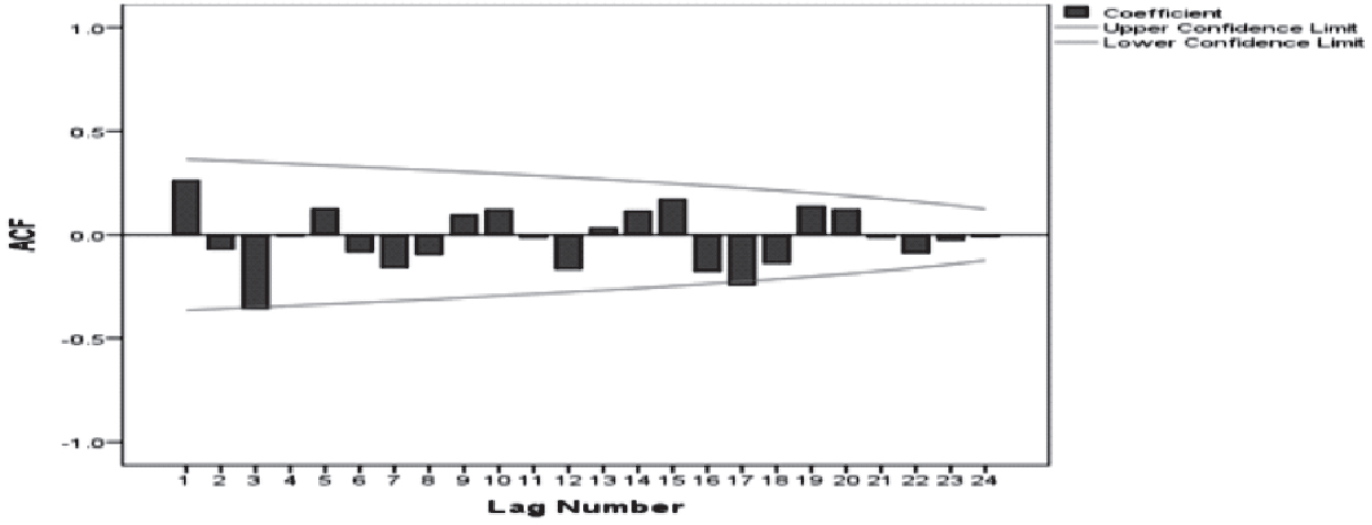
- Auto correlation function (ACF)
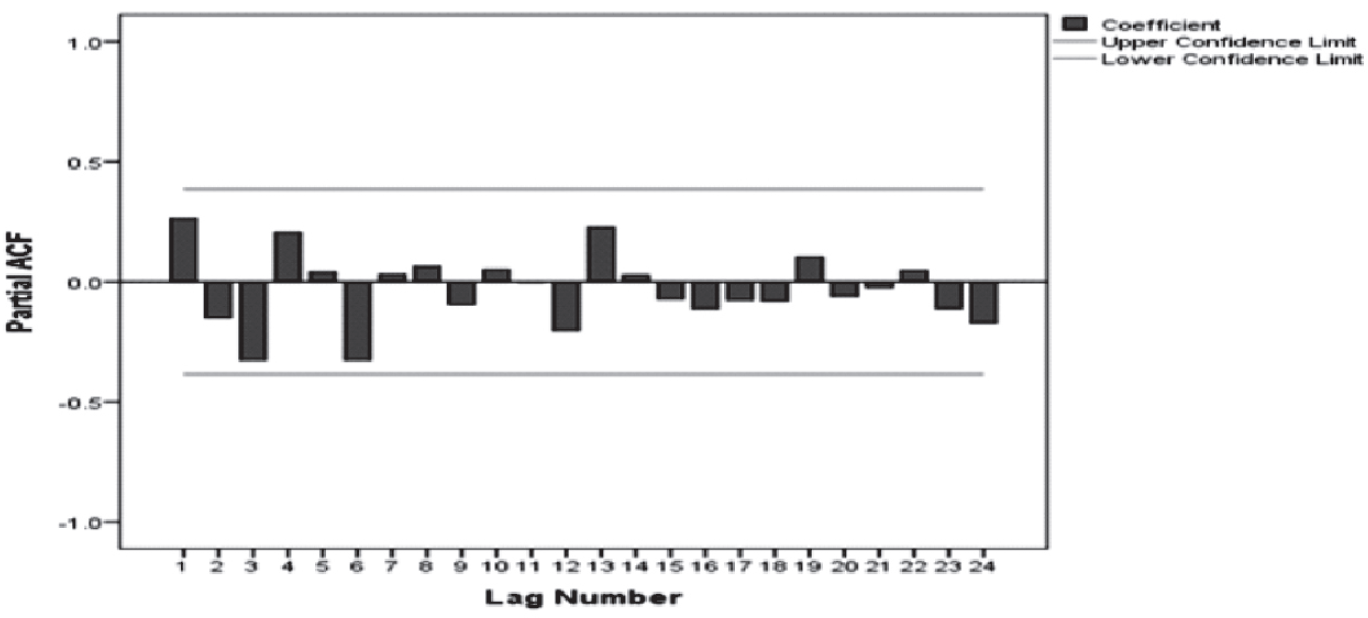
- Partial auto correlation function (PACF)
Henceforth, ARIMA models (p, d, q), for such scenario was applied. The best suitable model was selected based on minimal Bayesian Information Criteria (BIC) value. In this study, the least BIC value is 0.070 (Table 1) and the corresponding model is ARIMA (10, 1, 9) with goodness of fit (R2=93%). The model verification is done by checking the residuals of the model (Figure 4). This is done through examining the autocorrelation and correlation of the residuals of various orders.
| ARIMA (p, d, q) | BIC | R-Squared |
|---|---|---|
| 9,1,11 | 0.336 | 0.93 |
| 9,1,10 | 0.081 | 0.92 |
| 10,1,9 | 0.070 | 0.93 |
| 10,1,10 | 0.378 | 0.92 |
| 10,1,11 | 0.631 | 0.93 |
| 10,1,12 | 1.008 | 0.92 |
| Year | Actual no. of cases (in millions) |
Forecasted no. of cases (in millions) | 95 % confidence Interval | |
|---|---|---|---|---|
| Lower limit | Upper limit | |||
| 1990 | 2.02 | -- | -- | -- |
| 1991 | 2.12 | 1.96 | 1.04 | 2.88 |
| 1992 | 2.13 | 2.11 | 1.24 | 2.98 |
| 1993 | 2.21 | 2.08 | 1.21 | 2.94 |
| 1994 | 2.51 | 2.14 | 1.32 | 2.96 |
| 1995 | 2.93 | 2.57 | 1.76 | 3.38 |
| 1996 | 3.04 | 2.98 | 2.17 | 3.80 |
| 1997 | 2.66 | 2.81 | 2.12 | 3.50 |
| 1998 | 2.22 | 2.26 | 1.58 | 2.94 |
| 1999 | 2.28 | 1.95 | 1.27 | 2.63 |
| 2000 | 2.03 | 2.26 | 1.59 | 2.94 |
| 2001 | 2.09 | 1.84 | 1.17 | 2.50 |
| 2002 | 1.84 | 1.72 | 1.06 | 2.38 |
| 2003 | 1.87 | 1.85 | 1.22 | 2.49 |
| 2004 | 1.92 | 1.95 | 1.32 | 2.58 |
| 2005 | 1.82 | 1.88 | 1.26 | 2.50 |
| 2006 | 1.79 | 1.84 | 1.21 | 2.46 |
| 2007 | 1.51 | 1.63 | 1.01 | 2.25 |
| 2008 | 1.53 | 1.49 | .87 | 2.11 |
| 2009 | 1.56 | 1.52 | .92 | 2.13 |
| 2010 | 1.60 | 1.61 | 1.01 | 2.20 |
| 2011 | 1.31 | 1.40 | .81 | 1.99 |
| 2012 | 1.07 | 1.20 | .61 | 1.79 |
| 2013 | .88 | .88 | .30 | 1.47 |
| 2014 | 1.10 | .99 | .41 | 1.58 |
| 2015 | 1.16 | 1.16 | .57 | 1.74 |
| 2016 | 1.08 | 1.12 | .54 | 1.70 |
| 2017 | .84 | .96 | .38 | 1.53 |
| 2018 | -- | .79 | .21 | 1.36 |
| 2019 | -- | .92 | -.07 | 1.91 |
| 2020 | -- | .93 | -.33 | 2.19 |
| 2021 | -- | .86 | -.47 | 2.19 |
| 2022 | -- | .64 | -.70 | 1.98 |
| 2023 | -- | .68 | -.67 | 2.04 |
| 2024 | -- | .62 | -.73 | 1.97 |
| 2025 | -- | .64 | -.71 | 1.98 |

- Residual ACF and PACF
The forecasted values for 2018 to 2025 were in proximity to the actual values (Figure.5 and Table. 2) and there by the validity of the model were ensured.

- Actual and forecasted cases
Discussion:
As early mentioned above ARIMA model consist of four steps, the first step was the identification of the model. The model identification done by ACF and PACF (Fig 2 & 3), it exposed increasing pattern in the number of cases of Malaria. Model parameters were estimated using SPSS ver. 23.0. In the forthcoming years (2018 to 2025), the model predicted a gradually increased. The malaria case which is 0.84 million in 2017 in expected to reduce to 0.64 millions in the year 2025. This implies that the existing interventions in our country will not be adequate to control the on-going epidemic even in another 8 years. With the current ongoing interventions in the country to control and manage malaria its seems to be a Himalayan task to achieve the target of sustainable developmental goal which has set an target to end the epidemics of AIDS, tuberculosis, malaria by the year 2030.
A rule of the thumb is to have at least 50 data points for developing a good ARIMA model. But in this study we have used 27 data points which is a limitation of this study.
Conclusion:
In this study, forecasting methods were applied to predict the number of malaria cases in India based on cases reported by NVDCP. Model prediction was done using ARIMA models in which the appropriate model was identified using minimum BIC value. The trend in forecasted values from 2018 to 2025 reveals that there is a steady decrease in the number of cases of Malaria. But the decline in the number of cases in not adequate enough to stop the malaria epidemic as stated in SDG. Hence, to prevent the disease from getting established as an endemic in these countries, additional interventions with an increase in the intensity of existing interventions and support of the international community along with WHO is essential.
References:
- Campaigns, World Health Day 2014: Preventing Vector-Borne Disease. Available from http://www.who.int/campaigns/world-health-day/2014/en/. (accessed )
- [Google Scholar]
- Estimation of True Malaria Burden in India. A Profile of National Institute of Malaria Research
- [Google Scholar]
- Estimation of True malaria burden in India. MRC http://www.mrcindia.org/ (accessed )
- [Google Scholar]
- Malaria, A Global Crisis. Available from http://www.unicef.org/media/media20475.html. (accessed )
- [Google Scholar]
- Malaria Epidemics: Forecasting, Prevention, Early Detection and Control. From Policy to Practice, Report of an Informal consultation, World Health Organization, Geneva, Switzerland. 2004
- [Google Scholar]
- What malaria costs India. Malaria Bureau 13. Government of India Press Delhi. Health Bull 1935 26 26
- [Google Scholar]
- National Vector Borne Disease Control Program (NVDCP) Available from http://www.nvbdcp.gov.in/index1.php?lang=1&level=1&sublinkid=5784&lid=3689. (accessed )
- [Google Scholar]
- Development of temporal modelling for forecasting and prediction of malaria infection susing time-series and ARIMAX analyses: A casestudy in endemic districts of Bhutan. Malaria Journal. 2010;9:251.
- [CrossRef] [PubMed] [Google Scholar]
- Forecasting Areas and Production of Rice in India using ARIMA model. International Journal of Farm Sciences. 2014;4(1):99-106.
- [Google Scholar]
- Time series forecasting using a hybrid ARIMA and neural network models. Neurocomputing. 2003;50:159-75.
- [CrossRef] [Google Scholar]
- Forecasting Dengue Hemorrhagic Fever Cases in Southern Thailand using ARIMA Models, Dengue Bulletin. . 2006;30:99-106.
- [Google Scholar]
- Distribution of residual autocorrelations in autoregressive- integrated Moving average time-series models. J Am Stat Ass. 1970;65:1509-26.
- [CrossRef] [Google Scholar]