Translate this page into:
Feasibility assessment of facility based blood glucose monitoring among patients with Tuberculosis in North India
Corresponding author: Dr. Dinesh Kumar, Associate Professor, Community Medicine, Dr. Rajendra Prasad Government Medical College, Kangra at Tanda, Himachal Pradesh-176001, India, Email: dinesh9809@gmail.com
-
Received: ,
Accepted: ,
How to cite this article : Feasibility assessment of facility based blood glucose monitoring among patients with Tuberculosis in North India. Singh M, Bhardwaj AK, Kumar D. J Comprehensive Health.2018; 6(2):103-111.
Abstract
Background:
Screening TB patients for Diabetes Mellitus (DM) could be an efficient tool for early diagnosis of DM leading to improved treatment outcomes and integrated management of TB-DM co-morbidity. It is feasible to conduct bidirectional screening for diabetes and TB in India, but the most effective way of doing it is still unknown.
Objective:
To assess the technical feasibility for glucometer based blood glucose assessment among TB patients and change of blood glucose during their treatment course at secondary health care centers of Northern Indian state.
Methods:
Prospective study was conducted among all patients diagnosed with TB at the three selected health facilities (District Hospital (DH), Community Health Centres (CHC)-1 and 2). All diagnosed TB patients were assessed for random blood glucose (RBG) using glucometer at three times during anti TB treatment.
Results:
A total of 200 TB patients were recruited andRBG across facilities observed a statistically significant decline ranging from 35.9 mg/dl in CHC-1 to 36.0 mg/dl in DH. On applying repeated measures model estimated average RBG means at the three points of contact in the TB patients were almost similar to original means and the reduction from baseline to second follow up was statistically significant also for type of facility (mean reduction for CHC Shahpur: 31.17; CHC NB: 30.98; DH Kangra: 27.00 mg/dl; p=0.00). The reduction from baseline to second follow up was still statistically significant when stratified for type of facility and diabetes status. (p=0.01)
Conclusion:
RBG or fasting blood glucose testing is feasible at health facility (primary or secondary level) during the registration of patient and during and after treatment completion.
Keywords
Diabetes mellitus
Tuberculosis
Longitudinal study

Introduction
The Revised National Tuberculosis Control Program (RNTCP) services were launched in 1993[1] as vertical and single disease oriented programme, which from 2016 started providing its services under the umbrella of National Health Mission (NHM) with consistent focus on Direct Observation therapy (DOT) along with changed diagnostic algorithms.[2]
The country accounts for 23% global cases of Tuberculosis (TB), with 2.2 million incident cases.[2] With concurrent occurrence of chronic non communicable diseases in India, the prevalence of Diabetes was estimated to be 9.5%.[3] The recent studies predicted that in India 18.4% (12.5-29.9%) of people with pulmonary tuberculosis (both smear positive and negative) have diabetes.[4] Diabetes increases threefold risk for development of active tuberculosis along with poor treatment outcomes, including death, treatment failure, and relapse.[5-9] Diabetes is believed to be undiagnosed in over half of individuals living with the disease.[10]
Under the operational guidelines for National Programme for control of Diabetes, Cancer and Stroke (NPCDCS) for 'opportunistic' screening of diabetes at primary and secondary health care centers, support for Glucometers, Glucose-strips and lancets are provided to the state. Health professionals and health care providers at various levels of health care were trained for early detection and management of Cancer, Diabetes, CVDs and Stroke.[11] There are three levels at which health care is imparted in public sector in India, i.e. primary, secondary and tertiary. Both the above national programmes are functional at these three levels of health care.[12]
Literature from across South Asia have demonstrated that screening TB patients for DM could be an efficient tool for early diagnosis leading to improved treatment outcomes and integrated management of TB-DM co-morbidity. It is feasible to conduct bidirectional screening for diabetes and TB in India, but the most effective way of doing it is still unknown. Done effectively, given the high rate of both diseases in India, screening will lead to earlier detection and better treatment of both diseases.[13-16]
Trained health professionals can effectively utilize glucometers under NPCDCS for screening of TB patients at the peripheral level.[17] Current study was planned to assess the technical feasibility for glucometer based blood glucose assessment among TB patients and change of blood glucose during their treatment course at secondary health care centers (district hospital (DH) and community health centers (CHC)) of Northern Indian state.
Methods
Himachal Pradesh is a northern state in India and has 12 districts with 68, 64, 602 population.[18] Primary health care in rural India is a three tier system based on recommendation of Shrivastav committee in 1975. The sub centre being the peripheral outpost of this system catering to 3000-5000 village population and one primary health centre (PHC) for every 20,000 to 30,000 rural population form the primary level. The next higher level is secondary level which comprises of district hospital (DH), zonal hospital and community health centre (CHC) one in each community development block for 80,000 to 1.20 lakh population which also serves as first referral level. The more specialized tertiary level is provided by regional or central level institutions.[12] According to Census 2011, study district (Kangra) has about 20.0% of state population with one zonal hospital, one DH and 21 CHCs, 91 primary health centers (PHC).[19] The facilities selected for study purpose were one DH and two CHCs as they are part of community based teaching program for medical graduates.
RNTCP covers the state with annual case detection rate of 201 per 1,00,000 population (2015). The state reported 97.0% coverage for treatment with 93.0% treatment completion rate; a better RNTCP performance across nation.[19] The study district also has the good coverage with case detection of TB, 185 per 1,00,000 population andcure rate of 87.3% and it contributes about 21.4% patients to state.[20]
Designated Microscopy Centres (DMCs) has been established at the level of health facility for provision of diagnostic services and registration of cases for treatment under the sub district nodal centre, that is Tuberculosis Unit (TU) per 0.1 million population.[21] Program provides drugs to each patient with the help of DOT provider which are health functionaries proximate to the residence of the patient. Evidence suggests that DOTS strategy is well implemented in integration with general health system and an additional support in terms of drugs, TU and DMC by the RNTCP.[21] As a routine in community settings individuals experiencing symptoms with TB usually report to health facility where he/she undergoes assessment for TB as per RNTCP guidelines. Once confirmed with TB; patient receives drugs under direct observation of health professionalusually a community level health worker or health worker positioned at peripheral health facility. If the patient resides in same village/area of the jurisdiction of facility the treatment box is kept at the same facility. If not, a referral form is filled and patient is sent to the tuberculosis unit (TU) of the block where he/she resides after giving one dose of Anti Tubercular Treatment (ATT). The treatment box is kept near his/her residence with the DOTS provider. The patient after the reminder by the DOTS provider goes to the facility for sputum examination follow up at the end of intensive and continuation phase of DOTS. At the same time the investigators through phone calls reminded patients to come to the facility near their residence for testing random/ fasting blood sugar.
Prospective study was conducted from April, 2014 through May 2015 including all patients diagnosed with TB (sputum smear positive and negative) as per RNTCP guidelines,[22] at the above mentioned three health facilities. These facilities are RNTCP approved DMCs and also serve as DOT centre for patients with TB residing in vicinity of facilities. The study district has 12 TU and 31 DMCs covering a population of 15,07,949 as per the information from District TB office.[20]
Inclusion criteria for selection of patients were; informed consent and age of more than or equal to 20 years. Cases already diagnosed with Human immunodeficiency virus (HIV) and Mycobacterium leprae infection were excluded from the study. Patients without telephonic details and those who were not permanent resident of the study area indicative of difficulty in follow up were also excluded. Written informed consent of all participants was obtained before gathering any information under the protocol approved by the Institution Ethics Committee.
Data regarding patient demographic characteristics, clinical and laboratory parameters were collected and entered into a structured case record form. Sputum positivity was defined as given by Ziehl Neelson stained sputum smears.[23] All diagnosed TB patients were assessed for random blood glucose (RBG) with recording for known or unknown case of DM. RBG was recorded using by glucometer (SD Codefree™ Blood glucose monitoring system, 2013) as a single random point glucose measurement in blood. Weight and height was recordedand Body Mass Index (BMI) was calculated and categorized according to WHO criteria for Asians.[24] The patients were kept on anti-tubercular treatment as per RNTCP guidelines. The TB patients on treatment wereassessed three times for blood glucose; at the time of diagnosis, at two months follow up and at end of treatment. The three point RBG assessments were done to exercise the opportunity of follow up sputum examination as recommended by the RNTCP to assess the treatment effect. The follow up visit was ensured with telephonic reminder for their scheduled follow up visit for sputum examination during and end of their treatment.
Patients were first asked whether they had a known diagnosis of DM. In patients with a known diagnosis, referrals were made back to diabetic clinic so that blood glucose levels could be controlled. In those with no known diagnosis of DM, random blood glucose (RBG) was carried out followed by FBG at the next visit if the RBG was =≥200 mg/dl (11.1mmol/l). The American diabetes association recommended RBG =≥200 mg/dl (11.1 mmol/l) as a diagnosis of diabetes in case of patients with severe hyperglycemia such as those who present with severe classic hyperglycemic symptoms or hyperglycemic crisis is found.[25] This cut off was used in the current analysis keeping in mind the hypothesis of infection induced hyperglycemia. The known diabetics diagnosed previously or taking oral hypoglycemic or insulin as prescribed by physician were categorized as diabetics. Confirmation by fasting blood glucose (FBG) was in line with those recommended by the WHO referred to physician for further management.[26] Those confirmed by FBG as diabetic were started oral hypoglycemic or insulin as per categorization. The variable used for outcome was RBG.
The data summarized as proportions were compared using chi square test. For comparison of mean level of glucose the paired student t test was applied. Level of significance was set at 5%. General Linear Modeling (GLM) for repeat measure assessment was done to account for clustering and to monitor the change in mean RBG level over the follow up period was done and the resulted estimated RBG mean was compared with original RBG mean at respective follow up time to assess any significant difference. The difference between baseline and follow-up blood glucose value was calculated and considered as dependent variable for multiple regression model to identify significantly associated independent variables. Though no outlier was detected and assumption for linearity and homoscedasticity were met, but positive skewness was observed and reduction variable was subjected to natural log transformation.
Results
DH caters to maximum population followed by CHC-2 and CHC-1. Cure rate was highest for CHC-1 (88%); CHC-2 (76.8%) and DH (76.5%) had almost same cure rate. All the three facilities had all required staff under RNTCP, with maximum at DH. (Table 1)
| Infrastructure | Type of facility | ||
|---|---|---|---|
| DH | CHC-1 (Nagrota Bagwan) | CHC-2 (Shahpur) | |
| Designated microscopy centre | Yes | Yes | Yes |
| Tuberculosis unit under which the DMC is registered | Tiara | Nagrota Bagwan | Shahpur |
| Population covered | 147376 | 116432 | 139714 |
| Medical officers | 9 | 4 | 5 |
| Lab technicians | 3 | 1 | 1 |
| DOTS provider | 1 | 1 | 1 |
| Radiographer | 1 | 1 | 2 |
| Total number of TB cases registered in 2014 | 101 | 128 | 93 |
| Cure rate | 76.5% | 88% | 76.8% |
A total of 200 TB patients were recruited from the three facilities; DH comprised 38.5%, CHC-1; 30.5% and CHC-2; 31.0% of the sample. Males outnumbered females at all the three facilities. Majority of the recruited patients with TB were new cases (Category 1) according to RNTCP in all facilities. CHC-1 had highest (80.3%) patients of category 1 as compared to DH (77.9%) and CHC-2 (69.4%). Majority of patients were in relatively younger age group (20-39 years) in DH (42.8%) and CHC-2 (50.0%), whereas CHC-1 had a large proportion (42.6%) of patients of age group 40-59 years. Patients were also assessed for overall nutrition status where across all facilities about half of patients were found to be undernourished. It was also observed that around one third of the patients were smoking tobacco currently (29.0%) and the proportion of current smokers was highest from CHC-1 (39.3%). Apart from smoking, alcohol use was also observed among quarter of patients in all facilities. Diabetes at baseline was diagnosed in majority from CHC-2 (14.5%) and overall 12.5% diabetics were diagnosed from all the centers. Newly diagnosed diabetics among TB patients were observed only from CHC-2 (9.7%; 6/62). (Table 2)
| Variables | Type of facility | ||
|---|---|---|---|
| DH Kangra | CHC-1 NagrotaBagwan | CHC-2 Shahpur | |
| Recruited TB patients at baseline | |||
| Total | 77 (100) | 61 (100) | 62 (100) |
| Category 1 | 60 (77.9) | 49 (80.3) | 43 (69.4) |
| Category 2 | 17 (22.1) | 12 (19.7) | 19 (30.6) |
| Total | 77 (100) | 61 (100) | 62 (100) |
| PTB | 48 (62.3) | 37 (60.7) | 40 (64.5) |
| EPTB | 29 (37.7) | 24 (39.3) | 22 (35.5) |
| Mean age (±SD) | 45.03±17.62 | 43.77±16.14 | 40.97±16.48 |
| Age groups (years) | |||
| 20-39 | 33 (42.8) | 24 (39.3) | 31 (50.0) |
| 40-59 | 29 (37.7) | 26 (42.6) | 20 (32.3) |
| =60 | 15 (19.5) | 11 (18.1) | 11 (17.7) |
| Sex | |||
| Male | 44 (57.1) | 44 (72.1) | 32 (51.6) |
| Female | 33 (42.9) | 17 (27.9) | 30 (48.4) |
| Mean BMI (±SD) | 17.99±3.40 | 17.96±3.21 | 17.74±2.62 |
| BMI (kg/m2) | |||
| <18 | 42 (54.5) | 31 (50.8) | 33 (53.2) |
| 18-22.9 | 28 (36.4) | 28 (42.0) | 28 (45.2) |
| 23-24.9 | 4 (5.2) | 1 (1.6) | 1 (1.6) |
| =25 | 3 (3.9) | 1 (1.6) | 0 |
| Smoking | |||
| Non smoker | 41 (53.2) | 24 (39.3) | 37 (59.7) |
| Current | 19 (24.7) | 24 (39.3) | 15 (24.2) |
| Ex -Smoker | 17 (22.1) | 13 (21.4) | 10 (16.1) |
| Alcohol intake | |||
| Yes | 20 (26.0) | 15 (24.6) | 15 (24.2) |
| No | 57 (74.0) | 46 (75.4) | 47 (75.8) |
| Sputum positivity | |||
| Positive | 38(49.4) | 28 (45.9) | 35 (56.5) |
| Negative | 39 (50.6) | 33 (54.1) | 27 (43.5) |
| Diabetes mellitus at baseline | 8 (10.4) | 8 (13.1) | 9 (14.5) |
| Newly diagnosed DM | 0 | 0 | 6(9.7) |
For RBG assessment the majority of patients in CHC-2 (30%) were lost to follow up compared to 14.3% and 9.7% in DH and CHC-1 respectively. RBG across facilities observed a statistically significant decline ranging from 35.9 mg/dl in CHC-1 to 36.0 mg/dl at DH. The decline was highest for CHC-2 (37.3±52.3 mg/dl) as majority of diabetics were observed at this centre with major decline in RBG. The mean reductions stratified according to diabetes status observed a significant decline across all types of facility accept for diabetics at DH. (Figure 1)
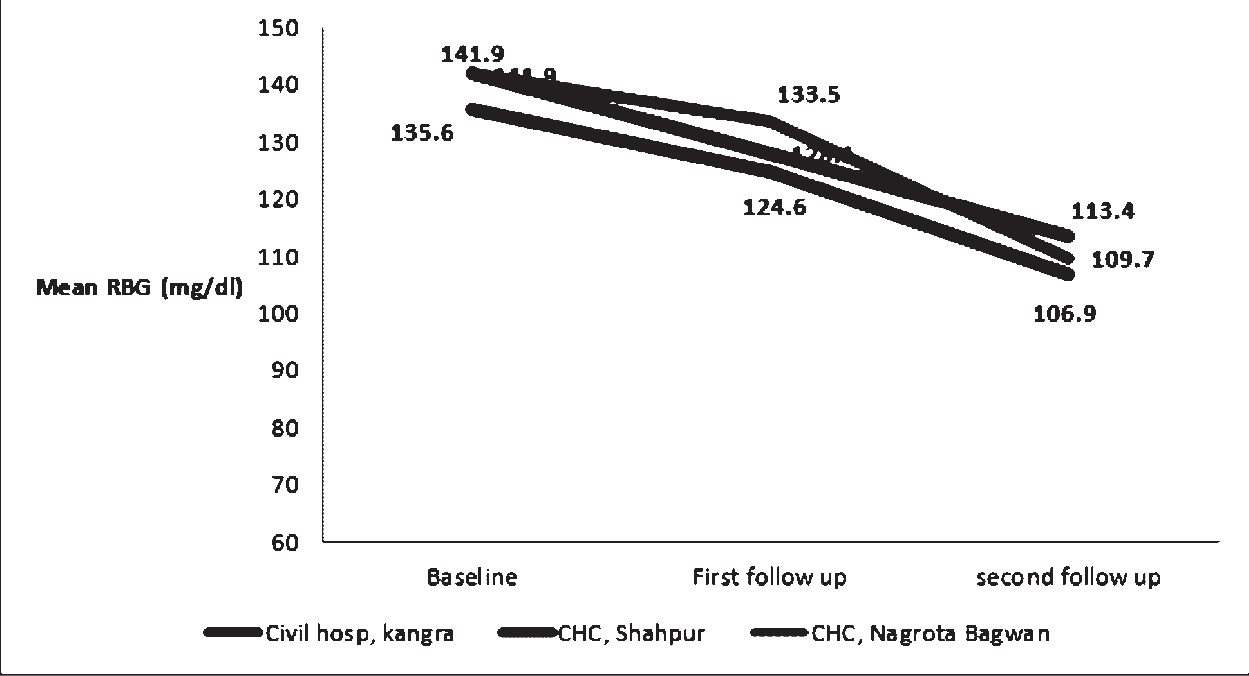
- Mean RBG at three points of contact at three facilities, Himachal Pradesh, 2014.
General linear model assessment observed that estimated average RBG means at the three points of contact in the TB patients after adjusting for age, sex, alcohol intake, smoking history, BMI, type and category of TB were almost similar to original means and the reduction from baseline (139.8 mg/dl) to second follow up (109.9 mg/dl) was statistically significant (p-0.00). The reduction from baseline to second follow up was still statistically significant when stratified for type of facility and diabetes status. (p=0.01) The mean reduction of estimated RBG gradually increased from DH to CHC-2 to CHC- 1 among diabetics. The mean reduction was higher among diabetics as compared to non diabetics. (Table 3 and Figure 2)

- Estimated marginal means of TB patients stratified according to facility at baseline, first and second follow up, Himachal Pradesh, 2014.
| N (Mean RBG ± SD) | |||||
|---|---|---|---|---|---|
| Baseline | First follow up | Second follow up | Mean reduction | P value | |
| DH | 77 (135.6±58.1) | 68 (124.6±39.9) | 66 (106.9±25.5) | 36.0±49.4 | 0.00 |
| With diabetes | 8 244.9±108.2 |
7 195.6±79.1 |
6 136.3+36.6 |
118.5±124.7 | 0.08 |
| Without diabetes | 69 122.9±31.6 |
61 116.4±22.4 |
60 103.9±22.5 |
27.8±24.6 | 0.00 |
| CHC-1 | 61 (141.9±57.2) | 49 (133.5±75.8) | 47 (109.7±25.6) | 35.9±48.6 | 0.00 |
| With diabetes | 8 252.1±73.8 |
7 232.0±167.7 |
7 130.7±25.5 |
123.1±82.9 | 0.02 |
| Without diabetes | 53 125.3±29.9 |
42 117.1±26.2 |
40 106.1+24.0 |
21.0±13.8 | 0.00 |
| CHC-2 | 62 (141.9±75.5) | 61 (128.1±49.3) |
58 (113.4±44.8) |
37.3±52.3 | 0.00 |
| With diabetes | 9 286.2±93.9 |
9 208.4±72.2 |
9 186.6±71.4 |
110.8±81.9 | 0.01 |
| Without diabetes | 53 117.5±33.3 |
50 113.7±24.9 |
47 99.3±16.4 |
23.3±28.9 | 0.00 |
Discussion
Current analysis demonstrated facility level blood glucose monitoring during the treatment phase of patients with tuberculosis as a feasible exercise by utilizing an opportunity of patient follow-up schedule of program. It was facilitated by telephone reminders to link improve patients' attendance under RNTCP for blood glucose assessment. At a tertiary care centre screening was demonstrated as an efficient tool for programme management of TB-DM co-morbidity; and reported 10.0% diabetics among 510 TB patients.[13] Current study shares experiences from district and CHC level with 13.5% prevalence of diabetes in patients of all the three facilities. Experience from Sri Lanka also observed that screening for DM was feasible and hinted the possibility of stress-induced hyperglycemia. It becomes important to screen patients in their early diagnostic phase for appropriate measures to reduce the high blood glucose levels.[15]
Evidence supported suggestions were placed for universal acceptability of testing for DM among TB patients with an availability of trained staff to use glucometers as supplied under NPCDCS with drugs for chronic disease management which helps to make this intervention feasible, without requirement for additional resources.[17] Feasibility studies from both tertiary care centre and peripheral health institutions reported that among patients with tuberculosis, more than half new cases of DM were diagnosed. The probable explanation for this was that patients reaching at major hospitals have multiple opportunities for screening before the diagnosis of tuberculosis, whereas patients diagnosed with tuberculosis at peripheral level are likely to be missed for diagnosis of DM without active and mandatory screening at time of diagnosis of tuberculosis.[25] However the newly diagnosed DM cases in current study constituted 24% (lower than other studies) of all diabetic cases diagnosed.
Peripheral facilities cater TB-DM co-morbidity of about 13.0% to 15.0% in our study. The screening efforts are well accepted by the community as almost all registered cases in our study with tuberculosis consented to be screened once offered to all.[17] So far literatures justify an effectiveness and feasibility of one time contact assessment for blood glucose, whereas current study expands the discussion about following patients for blood glucose at the three points of contacts for assessing presence of infection induced hyperglycemia (IIH). It can account for type-I error which if not dealt with may result in higher prevalence of DM among patients with tuberculosis as blood glucose levels are expected to decline in presence of IIH as bacterial load decreases due to treatment. This has been pointed out in a case control study carried out in Turkey; oral glucose tolerance test (OGTT) was performed at the time of diagnosis in active PTB patients which reported 10.4% glucose intolerant and 8.6% diabetic patients. All patients had normal blood glucose values at 3 months and 2 years after start of treatment.[28] In a study from Nigeria, TB patients with impaired glucose tolerance had normal tests after 3 months of tuberculosis treatment and only 1.9% were diabetic at 3 months of treatment.[29] Concern over temporary elevation of blood glucose levels resulting in false-positive diagnoses of diabetes on early investigations have been raised. Contradictory to this delayed screening may be a missed opportunity for early initiation of diabetes treatment and health education during the intensive phase of TB treatment, which potentially would have positive effects on both the management of diabetes and the results of TB treatment. Hence testing at the time of diagnosis, in the TB diagnostic facility, may be advisable also for practical reasons.[30]
Another concern for repeated measurements of blood glucose to confirm the diagnosis will result in significant misclassification of cases of diabetes because of mixture of biological variation in blood glucose levels due to infection.[31] There is paucity of research presenting with repeated measures of blood glucose from the country. A study from India was conducted with four weekly follow up by OGTT till 12 weeks after start of chemotherapy showing a mean fall of glucose level of 33.8 mg/100ml from 0 to 12th week in the 23 patients with impaired glucose tolerance (P< 0.001).[32] Similarly in the present study the mean reduction of random blood glucose from the time of diagnosis of TB till the end of anti tubercular treatment among all TB patients was 35.9, 36.0 and 37.3 mg/dl at CHC-1, DH and CHC-2 respectively (p- 0. 00). Since repeated measurements of blood glucose were made on the same subject, values of blood glucose could have been subjected to random error. To rule out regression to mean as a cause of observed reduction in RBG each subject's follow up measurement was adjusted according to their baseline measurement using GLM. Stratification was done for mean blood glucose across three facilities with their diabetes status, and mean reduction was similar and significant across all the three facilities. Estimated mean reduction at the three facilities among patients with tuberculosis was significantly lower than the original mean reduction due to regression to mean effect. Hence even after accounting for the measurement error the reduction in mean blood sugar remained significant after treatment of tuberculosis.
Early screening for DM has some benefits including initiation of diabetes treatment, education of patients and correction of hyperglycemia, which potentially could have positive effects on the outcome of TB treatment.[33] As hyperglycemia may regress after treatment of TB, verification of glucose intolerance after cure of TB is necessary. Even after the return of blood sugar to normal level, subsequent monitoring is necessary, because it has been shown that a history of impaired fasting glucose is a strong predictor of subsequent diabetes.[34,35] WHO collaborative framework for control of diabetes and tuberculosis recommended that type of screening and diagnostic tests should be adapted to the context of local health systems and the availability of resources, while awaiting additional evidence on the best screening and diagnostic approach.[30]
The screening criteria used in this study for DM was random blood sugar rather than the fasting plasma glucose due to technical feasibility and cost effectiveness. Also the patient reached the DOTS centre with his diagnostic reports at the time of day when it was not possible to obtain fasting sample, hence random blood sugar remains practically feasible option. Moreover due to geographical constraints of the study area it was difficult for a patient to come back to the facility once he goes to his residence. Using multiple contacts with TB patients under DOTS made it feasible for us to measure and monitor blood sugar levels at follow up.
One of the limitations of the study was treatment for diabetes which acted as a confounding factor as it leads to decrease in the effective sample size and study power, once stratified for known diabetics and non-diabetics.
Conclusions
Current experience suggests that blood glucose testing is feasible at health facility (primary or secondary level) during the registration of TB patient and during and after treatment completion. At each of facility there is a significant reduction in mean blood glucose though the difference was almost similar across all facilities. Reduction in blood glucose needs to be considered after treatment completion before labeling the patient as an incident case of DM.
Conflict of Interest:
None declared
Source of support:
Nil
References
- Division, Government of India, TB India 2016, Revised National TB control programme, Annual Status Report. In: Central TB Division. Vol 9. 2016.
- [Google Scholar]
- Diabetes and tuberculosis: the impact of the diabetes epidemic on tuberculosisincidence. BMC Public Health. 2007;7:234.
- [CrossRef] [PubMed] [Google Scholar]
- Diabetes mellitus and tuberculosis in countries with high tuberculosis burdens: individual risks and social determinants. Int J Epidemiol. 2011;40:417-28.
- [CrossRef] [PubMed] [Google Scholar]
- Executive Board. 134th session. Global strategy and targets for tuberculosis prevention, care and control after. Geneva: World Health Organization; 2015. 2013.
- [Google Scholar]
- Improving tuberculosisprevention and care through addressing the global diabetesepidemic: from evidence to policy and practice. Lancet Diabetes Endocrinol. 2014;2:730-39.
- [CrossRef] [PubMed] [Google Scholar]
- Tuberculosis comorbiditywith communicable and non-communicable diseases: integratinghealth services and control efforts. Lancet Infect Dis. 2013;13:436-48.
- [CrossRef] [PubMed] [Google Scholar]
- Reasons for the decline of mortality in England and Wales during the nineteenth century. Popul Stud. 1962;16:94-122.
- [CrossRef] [Google Scholar]
- The looming co- epidemic of TB-Diabetes: A call to action.International Union against Tuberculosis and Lung Disease. 2014. p. :24p.
- [Google Scholar]
- Directorate of health services. MoHFW. Operational guidelines on National Programme for control of Diabetes, Cancer and Stroke (NPCDCS) . 2013-17;2013
- [Google Scholar]
- Health care of community in Park's textbook of Preventive and Social Medicine. (23rd). Jabalpur, India: Bhanot publishers; 2015.
- [Google Scholar]
- Tuberculosis-diabetes mellitus bidirectional screening at a tertiary care centre, South India. Public Health Action. 2013;3(1):18.
- [CrossRef] [PubMed] [Google Scholar]
- Screening patients with tuberculosis for diabetes mellitus in Gujarat, India. Public Health Action. 2013;3(S1):S29-S33.
- [CrossRef] [PubMed] [Google Scholar]
- Screening patients with tuberculosis for diabetes mellitus in Ampara, Sri Lanka. Public Health Action. 2015;5(2):150-152.
- [CrossRef] [PubMed] [Google Scholar]
- Screening tuberculosis patients for diabetes in a tribal area in South India. Public Health Action. 2013;3(S1):S43-S47.
- [CrossRef] [PubMed] [Google Scholar]
- Is screening for diabetes among tuberculosis patients feasible at the field level. Public Health Action. 2013;3(S1):S34-S37.
- [CrossRef] [PubMed] [Google Scholar]
- Provisional Population Totals, Paper 1 of 2011 India, Series-1. New Delhi: Office of the Registrar General & Census Commissioner; 2011.
- [Google Scholar]
- Division, Government of India, TB India 2016, Revised National TB control programme, Annual Status Report. Vol 9. New Delhi: Central TB Division; 2016.
- [Google Scholar]
- Himachal Pradesh: National Health Mission, State Tuberculosis office; 2014. 2015. p. :14p.
- Government of India, TB India 2013, Revised National TB control programme, Annual Status Report. New Delhi: Central TB Division; 2013. p. :35.
- [Google Scholar]
- Diagnostic Standards and Classification of Tuberculosis in Adults and Children. Am J Respir Crit Care Med. 2000;161:1376-95.
- [CrossRef] [PubMed] [Google Scholar]
- Appropriate body-mass index for Asian populations and its implications for policy and intervention strategies. Lancet. 2004;363:157.
- [CrossRef] [PubMed] [Google Scholar]
- Definition and diagnosis of diabetes mellitus and intermediate hyperglycaemia. In: Summary of Technical Report and Recommendations. Geneva, Switzerland: WHO; 2006. http://whqlibdoc.who. int/publications/2006/ 9241594934_eng.pdf.
- [Google Scholar]
- High prevalence of undiagnosed diabetes among tuberculosis patients in peripheral health facilities in Kerala. Public Health Action. 2013;3(S1):S38-S42.
- [CrossRef] [PubMed] [Google Scholar]
- The oral glucose tolerance test in patients with respiratory infections. Monaldi Arch Chest Dis. 1999;54:307-10.
- [Google Scholar]
- The significance of glucose intolerance in pulmonary tuberculosis. Tubercle. 1990;71:135-138.
- [CrossRef] [PubMed] [Google Scholar]
- Provisional collaborative framework for care and control of tuberculosis and diabetes. In: WHO/HTM/TB/2011. Geneva, Switzerland: WHO; 2011. p. :15. http://whqlibdoc.who.int/publications/2011/9789241502252 eng.pdf (accessed )
- [Google Scholar]
- Diabetes and tuberculosis: the impact of the diabetes epidemic on tuberculosis incidence. BMC Public Health. 2007;7:234.
- [CrossRef] [PubMed] [Google Scholar]
- Impaired glucose tolerance in active pulmonary tuberculosis. Indian Journal of Tuberculosis. 1984;31:118-121.
- [Google Scholar]
- Diabetes mellitus and tuberculosis facts and controversies. Journal of Diabetes & Metabolic Disorders. 2013;12:58.
- [CrossRef] [PubMed] [Google Scholar]
- Associated tuberculosis and diabetes in Conakry, Guinea: prevalence and clinical characteristics. Int J Tuberc Lung Dis. 2006;10(9):1036-1040.
- [Google Scholar]
- Progression to clinically diagnosed and treated diabetes from impaired glucose tolerance and impaired fasting glycaemia. Diabet Med. 2003;20Diabet Med. 2003;1027(12)
- [CrossRef] [PubMed] [Google Scholar]