Translate this page into:
Estimating the burden of reproductive tract infections and its determinants amongst reproductive age group women residing in rural and urban settings in North India-a cross sectional comparative analysis
CORRESPONDING AUTHOR: Dr. Shipra Saini, Assistant Professor, Department of Community Medicine, ESIC Medical College and Hospital, Faridabad, Haryana E Mail ID: shipraasaini81@gmail.com
-
Received: ,
Accepted: ,
CITATION: Singh M, Gupta E, Goswami G, Bansal G, Saini S, Goyal P. Estimating the burden of reproductive tract infections and its determinants amongst reproductive age group women residing in rural and urban settings in North India-a cross sectional comparative analysis. J Comp Health. 2023;11(1):05-12. Doi: https://doi.org/10.53553/JCH.v11i01.002
Abstract
Background:
There is dearth of community based nationally representative data on Reproductive tract infections (RTI). Evidence suggests the stigma associated with the symptoms lead to poor health seeking behaviour among women.
Objective:
To estimate the prevalence and determinants of RTI symptoms among women of reproductive age (WRA) group in a selected rural and urban slum of district Faridabad, Haryana.
Methodology:
An analytical cross-sectional study was conducted among 15-49 years age group ever married women residing in an urban slum and rural area of Faridabad. Minimum sample size was calculated to be 345. Systematic random sampling was used to interview eligible population using a predesigned structured questionnaire. Outcome variable of interest was at least one symptom of RTI. Prevalence ratio was calculated to identify the association between determinants and outcome.
Results:
Prevalence of at least one symptom of RTI among the women in urban area was 46.3% and 39.8% in rural area. Condom usage was higher among rural (20.4%) as compared to urban women (13.4%). Women in rural area reported higher proportion of abortions as compared to urban slum (10.2% vs 7.4%). The bivariable analysis revealed that use of sanitary pads, high parity, condom usage by partner and age at marriage as significant association with outcome. When subjected to generalized linear model non usage of condoms by partner (Adj PR (95%CI); 3.31 (1.14-9.57)) remained as an independent determinant of risk of RTI symptoms.
Conclusion:
Condom usage by partner in this study has emerged out be a protective factor for risk of RTI symptoms.
INTRODUCTION
Sexually transmitted infections (STIs) and reproductive tract infections (RTIs) continue to be a major public health problem despite the evidence-based treatment available for the illness.1
Certain Demographic factors like population explosion, rural to urban migration undoubtedly contribute to increase in STDs but numerous social and behavioural factors are also involved in their spread. The stigma and hesitation toward the STIs/RTI are the leading factors for negligent attitude among women toward the symptoms in the early phase of the illness thereby advancing to complications like pelvic inflammatory disease (PID), infertility, cervical cancer, puerperal sepsis, chronic pelvic pain, and ectopic pregnancy.2
In India, 40 million new cases of RTI/STI emerge each year.3 Due to limited access and affordability of STI laboratory diagnosis at the primary level of care where majority of STI cases seek care, syndromic case management remains the cornerstone of STI control.
Syndromic approach is based on presence of signs and symptoms reported, and provides immediate treatment for the most common organisms causing the identified syndrome through the use of pre-packaged colour coded drug kits. Both type of STIs, that is ulcerative and non-ulcerative, are prevalent in India, however the profile of the patient varies with changes in socioeconomic, cultural, geographic, and environmental factors prevalent in different parts of the country.4-11
The present study aims to analyse and compare the prevalence and determinants of STI/RTI symptoms in two different setting that is urban slum and rural population of women in their reproductive age group which would eventually help the health administrator in providing better services for its treatment and control.
MATERIAL & METHODS
Study design:
Community based cross-sectional study.
Study period:
Six months between July-December 2019.
Study population:
Ever married women of reproductive age group (15-49 years age group) residing in urban slum and rural field practice area of a tertiary care centre of Faridabad, Haryana.
Sample size & sampling method:
Taking prevalence of any RTI/STI symptoms among WRA as 23.3% from NFHS-4 (Haryana)12 at 20% relative error and 95% confidence interval the minimum sample size calculated is 335. After conducting the study complete records of 345 participants were included. The list of eligible candidates was extracted from the departmental data base -married female in the reproductive age group residing in the urban slum and rural area of district Faridabad. House to house visit was conducted and ever married women between 15-49 years age group were included using systematic random sampling method for the survey. There are 700 houses in the rural catchment area and 530 in urban. The number of houses to be surveyed from rural and urban areas was based on representation of houses in both areas (57% from rural and 43% from urban). Every 4th house with 15-49 year woman as per list in rural and urban area was surveyed. One eligible female from the household was recruited using kish grid method. If there were more than one eligible female in the surveyed house, they were numbered with youngest being given number one and eldest eligible the last in series. A table was created with rows for each household visited and columns for number of eligible females. If x is number of households visited and y is number of study population to be visited then we select row x and column y from table. The number reflected will be the one selected from the house. If the selected female was not available in the house during visit, it was revisited twice. If any eligible female was not available even after three visits, next house was surveyed.
Study tool and data collection:
A self designed, pilot tested, structured questionnaire was introduced consisting of sociodemographic details; information on presence of RTI/STI symptoms in 12 months before the survey, viz., vaginal discharge (VD), vaginal itching (VI), lower abdominal pain (LAP), genital ulcer (GU), burning micturition, dysuria, pain during intercourse; information related to family planning methods used and care seeking behaviour pertaining to these symptoms.
The quantitative data was entered in Microsoft excel sheet and analysed using Epi info version 7 (CDC). The categorical variables are presented using proportions. Continuous variables were presented as mean. Prevalence ratio (PR) was calculated for individual factors with at least one RTI symptom as outcome. Further independent variables with p<0.10 were subject to generalized linear model (binary logistic) with at least one symptom of RTI as dependent variable and adjusted PR were presented with their confidence intervals (CI). Different assumptions were tested for both the simple and multiple models: (1) linearity; (2) normality of residuals;(3) multicollinearity (for the multiple regression only); (4) homoscedasticity; and (5) uncorrelatedness of independent variables with the error term. The statistical significance level is set at 5%.
Ethical consideration:
The objectives of the study were explained by the interviewers and written informed consent was taken prior to start of interview from the participants. Ethical clearance was obtained from the Institute Ethics Committee of the institute vide no. I EC No. 134/A/11/16/Academics/MC/2016/107.
RESULTS
Socio demographic profile:
The study population's mean age was 29.5 years (±2SD, 6.5 years); with higher mean age among urban population. Majority had completed high school education (23.8%) and were homemaker (91.6%). Mean duration of marriage was 11.6 years (±2SD; 7.2 years). Majority (42.1%) belonged to lower middle-class socio-economic status. (Table 1)
| Variable | Rural | Urban Slum | Total |
|---|---|---|---|
| 196 (56.8) | 149 (43.2) | 345 (100) | |
| Mean age | 28.9±6.4 | 30.2±6.4 | 29.5±6.5 |
| Education | |||
| Illiterate | 44 (22.4) | 22 (14.8) | 66 (19.1) |
| Primary incomplete | 3 (1.5) | 6 (4.0) | 9 (2.6) |
| Primary complete | 39 (19.9) | 29 (19.5) | 68 (19.7) |
| Secondary complete | 25 (12.8) | 27 (18.1) | 52 (15.1) |
| High school | 45 (23.0) | 37 (24.8) | 82 (23.8) |
| Intermediate | 25 (12.8) | 12 (8.1) | 37 (10.7) |
| Graduate and above | 15 (7.7) | 16 (10.7) | 31 (9.0) |
| Occupation | |||
| Homemaker | 184 (93.9) | 132 (88.6) | 316 (91.6) |
| Unskilled worker | 8 (4.1) | 4 (2.7) | 12 (3.5) |
| Skilled worker | 4 (2.0) | 13 (8.7) | 17 (4.9) |
| Religion | |||
| Hindu | 180 (91.8) | 145 (97.3) | 325 (94.2) |
| Muslim | 16 (8.2) | 4 (2.7) | 20 (5.8) |
| Current marital status | |||
| Married | 192 (98.0) | 147 (98.7) | 339 (98.3) |
| Divorced/Separated | 4 (2.0) | 2 (1.3) | 6 (1.7) |
| Duration of Marriage (years) | 10.6±6.8 | 12.9±7.4 | 11.6±7.2 |
| Socio economic status (BG Prasad classification) | |||
| Upper class | 17 (9.8) | 2 (1.4) | 19 (6.0) |
| Upper middle class | 44 (25.4) | 21 (14.7) | 65 (20.6) |
| Middle class | 47 (27.2) | 52 (36.4) | 99 (31.3) |
| Lower Middle class | 65 (37.6) | 68 (47.6) | 133 (42.1) |
Menstrual practices and Obstetric history of Study population:
Age of menarche was 13.2 years for study population (±2SD, 1.7 years). More than half used (53%) sanitary pad during menstruation, the use was higher among rural population (56.1% in rural and 49% urban). Mean number of absorbents used was higher among rural women. Mean number of pregnancies was higher among urban women. More than half of urban women ever used family planning method (53%) as compared to 49% of rural women. 28.9% of urban women had undergone tubectomy. IUD was used by 18.4% of rural women as compared to 5.4% of urban women. Oral contraceptives (3.8%) and inject able contraceptive (1.2%) was the least popular family planning methods among study population. Condom use was higher among rural (20.4%) as compared to urban women (13.4%). (Table 2)
| Variable | Rural | Urban Slum | Total |
|---|---|---|---|
| Menarche at age (years) | 12.8±1.6 | 13.7±1.7 | 13.2±1.7 |
| Absorbent used during menstruation | |||
| Cloth | 64 (32.7) | 50 (33.6) | 114 (33.0) |
| Sanitary Pad | 110 (56.1) | 73 (49.0) | 183 (53.0) |
| Both | 22 (11.2) | 26 (17.4) | 48 (13.9) |
| Number of absorbents used in one day | 2.3±0.8 | 1.4±1.1 | 1.9±1.8 |
| Number of pregnancies | 2.9±1.8 | 3.2±1.8 | 3.1 ±1.8 |
| Number of live births | 2.2±1.2 | 2.4±1.4 | 2.3±1.3 |
| Any abortions in last one year | |||
| No | 176 (89.8) | 138 (92.6) | 314 (91.0) |
| Yes | 20 (10.2) | 11 (7.4) | 31 (9.0) |
| Type of abortion | |||
| Spontaneous | 12 (60.0) | 7 (63.6) | 19 (61.3) |
| Induced | 8 (40.0) | 4 (36.4) | 12 (38.7) |
| Follow up after spontaneous abortion | |||
| Yes | 6 (50.0) | 4 (57.1) | 10 (52.6) |
| No | 6 (50.0) | 3 (42.9) | 9 (47.4) |
| Ever used Family Planning method | |||
| No | 100 (51.0) | 70 (47.0) | 170 (49.3) |
| Yes | 96 (49.0) | 79 (53.0) | 175 (50.7) |
| Condom | |||
| No | 156 (79.6) | 129 (86.6) | 285 (82.6) |
| Yes | 40 (20.4) | 20 (13.4) | 60 (17.4) |
| Pills | |||
| No | 190 (96.9) | 142 (95.3) | 332 (96.2) |
| Yes | 6 (3.1) | 7 (4.7) | 13 (3.8) |
| Intra uterine device (IUD) | |||
| No | 160 (81.6) | 141 (94.6) | 301 (87.2) |
| Yes | 36 (18.4) | 8 (5.4) | 44 (12.8) |
| Duration of IUD use | 3.9±2.7 | 2.3±1.4 | 3.7±2.6 |
| Injectable contraceptive | |||
| No | 194 (99.0) | 147 (98.7) | 341 (98.8) |
| Yes | 2 (1.0) | 2 (1.3) | 4 (1.2) |
| Tubectomy | |||
| No | 175 (89.3) | 106 (71.1) | 281 (81.4) |
| Yes | 21 (10.7) | 43 (28.9) | 64 (18.6) |
Prevalence of sexually transmitted infection syndromes:
Majority of women in urban (46.3%) and rural (39.8%) area observed vaginal discharge. Lower abdominal pain was reported by 30.2% of urban and 29.1% of rural women. (Figure 1)
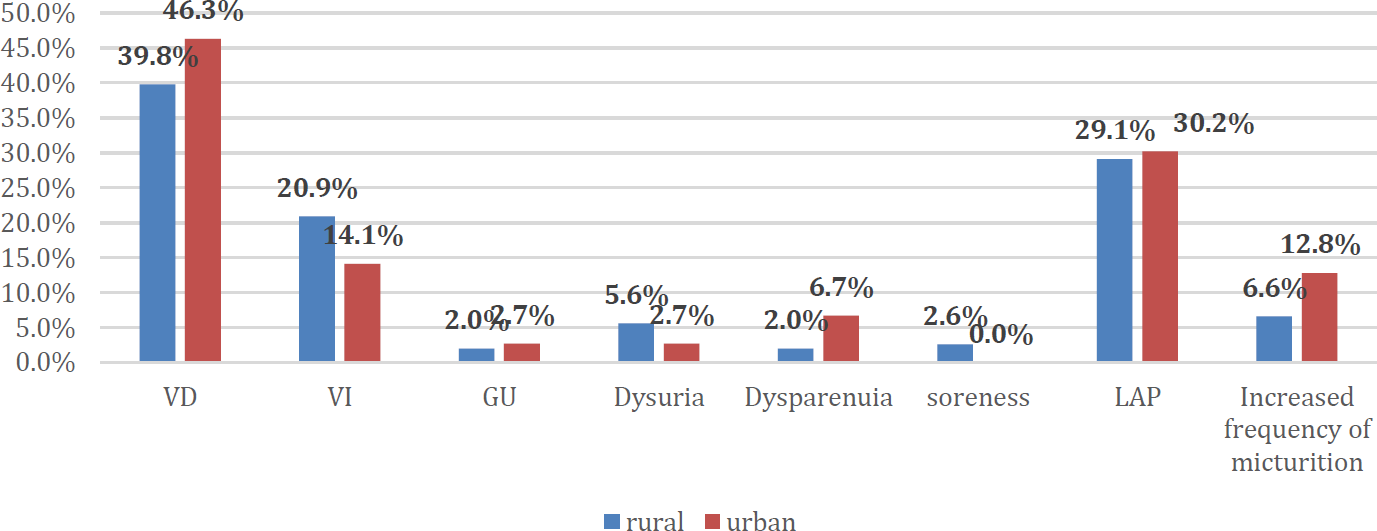
- RTI SYMPTOMS DISTRIBUTION IN STUDY POPULATION
Determinants of Women presenting with any one symptom of RTI/StI:
The bivariable analysis of hypothesized variables and outcome has been presented in table 4. Study population using sanitary pads during menstruation had 41% lower probability (PR (95%CI); 0.59 (0.44-0.79)) of reporting at least one RTI symptom in comparison to those using both cloth and pads (p:0.002). Significantly higher parity was observed among women with symptoms of RTI as compared to those with no symptoms (3.4±1.9 vs 2.8±1.7), (p:0.01). Probability of symptoms was 42% higher among those not using condoms (PR (95%CI); 1.42 (0.96-2.10)) as compared to those who used it (p:0.06). A significantly lower mean age of marriage was observed among those with at least one symptom of RTI (p:0.04). (Table 3)
| At least one symptom of RTI symptoms | |||||
|---|---|---|---|---|---|
| Yes | No | Total | Un Adj PR, 95% CI | p value | |
| 147 (46.3) | 198 (57.4) | 345 (100) | |||
| Age at marriage | 17.54±2.87 | 18.33±3.44 | 17.99±3.23 | - | 0.04 |
| Area | |||||
| Rural | 78 (39.8) | 118 (60.2) | 196 (100) | 0.85 (0.67-1.09) | 0.23 |
| Urban Slum | 69 (46.3) | 80 (53.7) | 149 (100) | 1 | |
| Socio economic status (BG Prasad classification) | |||||
| Upper class | 11 (57.9) | 8 (42.1) | 19 (100) | 1.13 (0.75-1.72) | 0.58 |
| Upper middle class | 42 (64.6) | 23 (35.4) | 65 (100) | 1.26 (0.99-1.62) | 0.07 |
| Middle class | 55 (55.6) | 44 (44.4) | 99 (100) | 1.09 (0.85-1.38) | 0.50 |
| Lower Middle class | 68 (51.1) | 65 (48.9) | 133 (100) | 1 | |
| Type of absorbent | |||||
| Cloth | 53 (46.5) | 61 (53.5) | 114 (100) | 0.77 (0.57-1.04) | 0.11 |
| Pad | 65 (35.5) | 118 (64.5) | 183 (100) | 0.59 (0.44-0.79) | 0.002 |
| Both | 29 (60.4) | 19 (39.6) | 48 (100) | 1 | |
| Number used in one day | 1.8±1.0 | 1.9±1.1 | 1.92±1.011 | - | 0.18 |
| Parity | 3.4±1.9 | 2.8±1.7 | 3.07±1.83 | - | 0.01 |
| Number of abortions | |||||
| None | 76 (35.8) | 136 (64.2) | 212 (100) | 0.66 (0.49-0.91) | 0.01 |
| One | 44 (53.0) | 39 (47.0) | 83 (100) | 0.98 (0.71-1.36) | 0.91 |
| Two or more | 27 (54.0) | 23 (46.0) | 50 (100) | 1 | |
| Method of abortion | |||||
| Spontaneous | 5 (55.6) | 4 (44.4) | 9 (100) | 0.88 (0.47-1.64) | 0.66 |
| Pills | 25 (45.5) | 30 (54.5) | 55 (100) | 0.72 (0.49-1.04) | 0.08 |
| Dilatation and curettage | 26 (63.4) | 15 (36.6) | 41 (100) | 1 | |
| Condom | |||||
| No | 128 (44.9) | 157 (55.1) | 285 (100) | 1.42 (0.96-2.10) | 0.06 |
| Yes | 19 (31.7) | 41 (68.3) | 60 (100) | 1 | |
| Pills | |||||
| No | 138 (41.6) | 194 (58.4) | 332 (100) | 0.60 (0.41-0.88) | 0.05 |
| Yes | 9 (69.2) | 4 (30.8) | 13 (100) | 1 | |
| iud | |||||
| No | 127 (42.2) | 174 (57.8) | 301 (100) | 0.93 (0.65-1.32) | 0.68 |
| Yes | 20 (45.5) | 24 (54.5) | 44 (100) | 1 | |
| Injectable | |||||
| No | 145 (42.5) | 196 (57.5) | 341 (100) | 0.85 (0.32-2.28) | 0.76 |
| Yes | 2 (50.0) | 2 (50.0) | 4 (100) | 1 | |
| Tubectomy | |||||
| No | 118 (42.0) | 163 (58.0) | 281 (100) | 0.93 (0.69-1.25) | 0.63 |
| Yes | 29 (45.3) | 35 (54.7) | 64 (100) | 1 | |
| More than one method | |||||
| No | 141 (42.3) | 192 (57.7) | 333 (100) | 0.85 (0.47-1.51) | 0.60 |
| Yes | 6 (50.0) | 6 (50.0) | 12 (100) | 1 | |
| Parameter | Adj PR (95% CI) |
|---|---|
| Type of material used during menstruation | |
| Cloth | 0.46 (0.14-1.49) |
| Pad | 0.78 (0.24-2.52) |
| Both | 1 |
| Condom used | |
| No | 3.31 (1.14-9.57) |
| Yes | 1 |
| Age of marriage | 0.88 (0.74-1.04) |
| Parity | 1.15 (0.77-1.72) |
| Number of abortions | 0.84 (0.49-1.43) |
| Method of abortion | |
| Spontaneous | 0.71 (0.14-3.47) |
| Pills | 0.47 (0.19-1.15) |
| Dilatation and curettage | 1 |
The Generalized linear model using binary logistic analysis was run with at least one symptom of RTI as dependent variable, categorical variables as factors and continuous variable as covariate having significance value p<0.06 in table 4. The adjusted prevalence ratio with 95% CI is presented for the factors in table 5. After taking all factors in account not using condom had around three times more probability of being affected with RTI (PR (95% CI); 3.31 (1.14-9.57)). (Table 4)
DISCUSSION
In the present community-based study, the prevalence of RTI/STIs among women of reproductive age was found to be 46% in urban slum area and 40% in rural area, this was almost double than the prevalence among women in Haryana as reported in NFHS 4 (23% in women). There was varied prevalence of RTI as reported by researchers among rural and urban Indian women. It was 49% in a rural district of Agra (U.P.),5 whereas 70% in rural area of Haryana.6 Comparatively, low prevalence was observed in the slum and rural areas of Chandigarh (21.6% and 17.7%, respectively).7,8 Prevalence in the rural community of West Bengal was 23.6%9 Latha et al.,10 in a multicentric study in rural West Bengal, Gujarat, urban Baroda, and Mumbai reported the prevalence of RTI, ranging from 19% to 71%. Another study done in urban slums of north east Delhi showed more than half of the study women (53.8%) had symptoms of RTI in the past.11High prevalence of 67.8% was reported in urban slum of Mumbai.13Similar prevalence of 39.9% was reported from rural area of Nepal.14
Above studies prove that urban slum women are more hit by the illness. Contrastingly NFHS-4 reported that self-reported STI symptoms were not affected by residence, education or socioeconomic status of population.5The marginal increase in prevalence of reporting of symptoms in urban slums in current study may be due to densely populated residential areas and lack of basic amenities like sanitation, clean water supply, electricity etc., moreover lack of privacy in these congested areas make women prone for sexually transmitted diseases and infections. The COVID pandemic has hit STI prevention and care activities just like other health programmes all across the globe with dramatically decreased reporting as compared with 2019.15 The international community also shares the similar data with an estimated 67.6 million prevalent and 26.2 million incident STIs in the United States in 2018.16 Vaginal discharge and lower abdominal pain were the most consistent symptom of RTI/STI among both rural and urban women in our study whereas similar study done in rural community of Haryana showed genital itching and vaginal discharge as most common symptoms.17 Kafle et al., from Nepal however reported backache as common symptom followed by vaginal discharge.14
Menstrual practise of using cloth during menstruation showed higher probability of RTI symptoms. A similar finding was reported by Philip et al., wherein women using ordinary cloth showed higher prevalence of RTI.18 Use of cloth as absorbent during menstruation as in our study shows the lack of awareness, careless attitude and lack of facilities for reproductive health.
The prevalence of symptoms was found to be significantly associated with parity and low age of marriage. The prevalence of symptoms was found to be lowest among the nulliparous and highest among the women with parity of three or more. This finding is comparable to a study done Anjana et al., from Delhi.19 They also presented a significant finding proving that contraceptive users were found to have lesser prevalence of RTI/STI symptoms as compared to nonusers both in urban and rural areas.19 Non usage of condom by partner was significantly associated with higher risk of RTI symptoms in the current study. However, the proportion of women reporting use of condoms by partners was lower as compared to those reported by Anjana et al., from rural and urban Delhi. In a study from Udupi District of South India it was reported that only 5% (of the total of 108) of the respondents used condoms while indulging in sex with a new partner at the migrated place.20 Male Condoms under National AIDS control programme are distributed free or through social marketing channels. It provides dual protection from STIs and conception. However, the prevalence of their use is still less than half. Patel V et al., in their study conducted in Goa reported condom use and oral contraceptive use associated with a reduced risk of RTI.21
The present study also reveals that prevalence was highest in those who had history of abortion in both urban and rural areas. Similar findings were reported by Rani et al.,22 and Philip et al.,18 where in prevalence was highest among the study subjects who had history of abortion. This can be attributed to the fact that operative procedures more so unsafe abortion practices as prevalent in India make women more prone to ascending infections.
LIMITATIONS
The study was limited by its nature of study design due to which temporal association cannot be established. Moreover, symptom-based prevalence is a proxy to the disease. We did not perform any laboratory investigations tests on women complaining of STI/RTI symptoms to know the exact prevalence of the disease, as the self-reported morbidity alone cannot be used to measure the burden of disease in the community. This study only catered to women hence the direct data of sexual behaviour of male partners were not available.
CONCLUSION
The study reveals that the prevalence of RTI/STI among women of reproductive age is quite high, with urban slum women being worse hit by the disease. Rapid urbanization without filling in basic amenities attribute to poor reproductive health. Menstrual practices, high birth order and number of abortions play a significant role in reproductive tract infections. Condom use among partners have a better edge of protection than other contraceptive users for RTI/STI.
RECOMMENDATIONS
Robust management and control of RTIs/STIs needs to be part of the primary health-care. First contact health workers should be reinforced to identify RTIs/STIs through the syndrome approach. There is need to educate women about their reproductive health issues and encourage them to seek treatment for them as well as their partners. Many infected persons may be unaware of their infections because STDs are often asymptomatic or unrecognized, being educated about reproductive health and using barrier methods can lower risk of contracting STIs. The stigma towards reproductive diseases can be alleviated through more awareness campaign and providing better facilities to the marginalized population of the community.
AUTHORS CONTRIBUTION
All authors contributed equally.
Source of Funding:
None declared
Acknowledgements
Authors wish to express gratitude to Dr Jyoti Yadav and Dr Prabhat Ranjan, Medical Officers who helped in data collection. We also thank the medical social workers of the department in helping us conduct household survey and the study population in cooperating to participate in the study.
Conflict of Interest:
None declared
References
- RTI/STI prevalence among urban and rural women of Surat: A community-based study. Indian J Sex Transm Dis. 2009;30:89-93.
- [CrossRef] [PubMed] [Google Scholar]
- Prevalence and awareness of reproductive tract infections among women in select under privileged areas of Bangalore city. Int J Med Sci Public Health. 2015;4:1691-6.
- [CrossRef] [Google Scholar]
- Community-based study of reproductive tract infections among women of the reproductive age group in the urban health training centre area in Hubli, Karnataka. Indian J Community Med. 2012;37:34-8.
- [CrossRef] [PubMed] [Google Scholar]
- Pattern of sexually transmitted infections and performance of syndromic management against etiological diagnosis in patients attending the sexually transmitted infections clinic of a tertiary care hospital. Indian J Sex Transm Dis. 2010;31:104-8.
- [CrossRef] [PubMed] [Google Scholar]
- Estimation of prevalence of RTIs/STDs among women of reproductive age group in Distt. Agra J Med. 2002;37:110-3.
- [Google Scholar]
- Community based study of reproductive tract infections among ever married women of reproductive age in a rural area of Haryana, India. J Commun Dis. 1999;31:223-8.
- [Google Scholar]
- Prevalence of vaginal discharge in an urban slum of Chandigarh. Med Gazette. 1994;138:431-2.
- [Google Scholar]
- Efficacy of syndromic approach in management of reproductive tract infections and associated difficulties in a rural area of Chandigarh. Indian J Community Med. 2002;27:110-3.
- [Google Scholar]
- A cyto-epidemiological study on married women in reproductive age group (15-49 years) regarding reproductive tract infection in a rural community of West Bengal. 2012. Indian J Public Health [serial online]. 56:204-9. Available from: https://www.ijph.in/text.asp?2012/56/3/204/104233 (accessed )
- [CrossRef] [PubMed] [Google Scholar]
- Prevalence of clinically detectable gynaecological morbidity in India: Results of four community-based studies. Fam Welf. 1997;43:8-16.
- [Google Scholar]
- Prevalence of reproductive tract infections and their determinants in married women residing in an urban slum of North-East Delhi, India. J Nat Sci Biol Med. 2015;6(1):S29-S34.
- [CrossRef] [PubMed] [Google Scholar]
- International Institute for Population Sciences (IIPS), National Family and Health Survey (NFHS-4), 2015-16, IIPS, Mumbai, India. 2017. Available from chrome-extension://efaidnbmnnnibpcajpcglclefindmkaj/http://rc hiips.org/nfhs/nfhs-4Reports/India.pdf
- [Google Scholar]
- An epidemiological study to find out the prevalence of RTI/STI and various factors associated with it among ever married women of reproductive age group in an urban slum community of Mumbai. IOSR J of Dental and Medical Sciences. 2014;13(3):9-15.
- [CrossRef] [Google Scholar]
- Prevalence and Factors Associated with Reproductive TractInfections in Gongolia Village, Rupandehi District, Nepal. Advances in Public Health 2016:8063843.
- [CrossRef] [Google Scholar]
- Trends in Nationally Notifiable Sexually Transmitted Disease Case Reports During the US COVID-19 Pandemic, January to December 2020. 2021. Sex Transm Dis. 48:798-804.
- [CrossRef] [PubMed] [Google Scholar]
- Sexually Transmitted Infections Among US Women and Men: Prevalence and Incidence Estimates, 2018, Sexually Transmitted Diseases: April 2021 -Volume 48 -Issue 4 -p 208-214.
- [CrossRef] [PubMed] [Google Scholar]
- KAP Study on Sexually Transmitted Infections/Reproductive Tract Infections (STIs/RTIs) among married women in rural Haryana. Indian Dermatol Online J. 2015;6(1):9-12.
- [CrossRef] [PubMed] [Google Scholar]
- Prevalence of symptoms suggestive of reproductive tract infections/sexually transmitted infections in women in an urban area of Ludhiana. Indian J Sex Transm Dis. 2013;34:83-8.
- [CrossRef] [PubMed] [Google Scholar]
- A Comparative Study of Prevalence of RTI/STI Symptoms and Treatment Seeking Behaviour among the Married Women in Urban and Rural Areas of Delhi. International Journal of Reproductive Medicine 2015:563031. Available from https://doi.org/10.1155/2015/563031
- [CrossRef] [PubMed] [Google Scholar]
- Factors determining sexual behaviour amongst siddi tribe migrating to Udupi district, India: A cross-sectional study. Niger Postgrad Med J. 2021;28:225-31.
- [CrossRef] [PubMed] [Google Scholar]
- The burden and determinants of reproductive tract infections in India: a population-based study of women in Goa, India. Sexually Transmitted Infections. 2006;82:243-249.
- [CrossRef] [PubMed] [Google Scholar]
- Prevalence of reproductive tract infections in married women in association with their past reproductive behaviour in district Gorakhpur. Indian Journal of Preventive & Social Medicine. 2009;40(3):199-202.
- [Google Scholar]