Translate this page into:
Assessment of Obesity among Adolescents from an Urban Area of Western India
Corresponding Author: Dr.Souvik Manna Email: souvikmanna311@yahoo.com) Address: All India Institute of Medical Sciences, AIIMS, New Delhi
Abstract
Introduction:
Obesity is on the rise among adolescents in urban areas owing to rising affluence and decline of traditional eating habits. Knowing the prevalence of obesity among adolescents is important for developing age- appropriate interventions for prevention of non-communicable diseases in the community.
Objectives:
To document the prevalence of obesity in a sample of urban adolescents residing in Western India and to compare their BMI for age with WHO 2007 and CDC 2000 growth charts for adolescents.
Methods:
The data was collected from a cross-sectional sample of 300 adolescents selected purposively, aged 15- 19 years residing in an urban area of Western India in the year of 2018. Age, gender and body mass index (BMI) were used to define overweight and obesity.
Result:
The prevalence of overweight and obesity was 10.3% and 4.3% respectively as measured by the WHO 2007 reference standards. The prevalence of overweight and obesity was 7.6% and 3.3% respectively when CDC 2000 standards were used and the difference was statistically significant using Chi-square test. Also, there was no significant difference on the basis of gender or socio-economic status of the adolescents using independent t test.
Conclusion:
One in six adolescents was either obese or overweight in our sample population. Males and females did not differ significantly on BMI categories and effect of socio-economic status was not documented.
Keywords
Overweight
Obesity
Adolescents
BMI

Introduction
India is witnessing a double epidemic of communicable as well non-communicable diseases in the current century. Youth represents a substantial proportion of Indian population and the eating habits of the youth today will determine the health of the nation in the future. Obesity and sedentary habits are on the rise in urban areas because of a huge penetration of modern technology that makes people more and more inert and inactive.
The National Family Health Survey (2015-16) district data showed that prevalence of obesity was 26.8% and 39.8% among men and women aged 15-49 years, respectively.(1) The currently available Indian growth reference curves are based on the data collected by Agarwal, et al.(2)(3) in 1989 which were published in 1992 and 1994 and were then adopted by the Indian Academy of Pediatrics for growth monitoring in 2007(4). The IAP standards were revised by Khadilkar et al(5) in his 2007 Multi-centric Study among affluent Indian children residing in all 5 zones of India. The WHO has been persuading paediatricians and governments all over the world to use the WHO growth charts for identifying underweight and overweight.(6)In February 2007, the Ministry of Women and Child Development (nodal ministry for the Integrated Child Development Services [ICDS] program) and the Ministry of Health and Family Welfare in India changed over from the IAP growth curve to the WHO child growth curves(7).Hence, the current study used the WHO and CDC reference charts for comparison, rather than the IAP charts.
Studies on adolescent obesity are generally not comparable because of different standards used for categorization. National Surveys like NFHS, Census etc. generally do not focus on adolescents and throw light on the burden only in the adult population. Hence, a need was felt to use internationally validated WHO 2007 BMI-for-age standards on a sample of urban adolescents residing in Western India.
Further, it was noted that previous studies for comparing growth standards are lacking in an Indian sample.
The current study is an effort to document the prevalence of obesity in a sample of urban adolescents residing in a city in Western India and to compare their BMI for age with WHO 2007 and CDC 2000 growth charts for adolescents.
Methodology:
Setting: Study was conducted in a city situated on the Western Coast of India having a population around 5 million, out of which 1 million is the adolescent population. The study population was urban adolescents which constituted about 20% of the entire population of the city.
Design: This was a cross-sectional analytical study conducted during the period between February 2018 and May 2018. It was done in two Primary Health Centres , which serve as urban training center of the Medical College. These two Primary Health Centres cater to around 1,00,000 population each.
Inclusion Criteria: The inclusion criteria was adolescents 15-19 years residing in the field practice areas of the two Primary Health Centres .
Sampling: Non-probability purposive sampling was used. Participants were recruited from AWCs (AnganwadiCentres) and local youth groups located in the field practice area of the college. All 20 AWCs in the field practice area of rural-PHC and 34 AWCs in Urban-PHC were included for the research. List of adolescents residing in the catchment area of each AWC was obtained from the worker. AWWs were directed to mobilize adolescents from their respective areas to the centre where the survey team conducted anthropometry. All adolescents walking into the centre were invited to participate in the study. As far as possible, the adolescents were called at a time convenient to them in order to not coincide with their school or college timings.
Sample size : The calculated sample size was 300 (using Open Epi Version 3.01) for the assumption of 11.2% prevalence of obesity (based on previous studies)(8), 5% absolute precision at 95% confidence limit, 5% allowable error and design effect of 2.
Data Collection: After informed consent, socio-demographic variables like age, sex, mother tongue, parental education etc were asked. The prevalence of overweight and obesity was assessed using anthropometric measurements (height, weight, BMI) of the sampled adolescents by the trained AWW. Body weight (kg) and body height (m) were measured with subjects wearing light clothing without shoes. The body mass index (BMI) was calculated as weight in kilograms divided by the square of the height in meters.
Analysis: Comparisons between two groups were performed using t-test and more than two groups using ANOVA (Analysis of Variance Test). The association between categorical variables was analyzed using chi-squared test and Fisher's exact test. Statistical analysis was performed using the Statistical Package for Social Sciences (SPSS, version 21.0) for Windows (SPSS Inc., Armonk, NY, USA).
Operational Definitions of overweight and obesity:
Two standards were used for the definitions of overweight and obesity: WHO 2007 BMI-for-age charts for adolescents (6-18 years z score): Separate growth charts were used for boys and girls because BMI varies significantly with the gender and age of the adolescents. Those having BMI between median + 1 SD/ -2 SD were classified as normal, those above +1 SD were classified as overweight and those above +2 SD were classified obese.
CDC 2000 BMI-for-age charts for adolescents (6-18 y percentile):
Participants who had body mass index (BMI) between 85th and 95th percentile of reference population were classified as overweight and BMI of above 95th percentile of reference population were classified as obese. BMI between 5th and 85th percentile was classified as normal.
Ethical Statement:
Study protocol was approved by the Institutional Review Board of Medical College, and study was conducted in conformity with the Declaration of Helsinki.
Results
Out of 300 study participants, 157 (52.3%) were males, 199 (66.3%) were from age groups 18-19 years, 283 (94.3%) were Hindus and around 50% were living with biological parents (Table 1).
| Gender | Total (n=300) |
|---|---|
| Male | 157 (52.3) |
| Female | 143 (47.6) |
| Age (in years) | |
| 15 | 1 (0.3) |
| 16 | 27 (9.0) |
| 17 | 73 (24.3) |
| 18 | 127 (42.3) |
| 19 | 72 (24.0) |
| Religion | |
| Hindu | 283 (94.3) |
| Others | 17(5.6) |
| Language | |
| Gujarati | 250 (83.3) |
| Hindi | 30 (10.0) |
| Others | 20 (6.6) |
| Parents' Highest Educational Qualification | |
| Primary | 109 (36.3) |
| Secon dary | 109 (36.3) |
| Pre-University | 37 (12.3) |
| Gradu ate | 24 (8.0) |
| Post Graduate | 21 (7.0) |
| Current living status | |
| With biological parents | 146 (48.6) |
| Residential facility (Rent/Hostel etc.) | 141 (47.0) |
| With biological m other/father | 7(2.3) |
| With adoptive parents | 6(2.0) |
*Percentages may not add to 100% because of rounding.
Table 2 shows that the mean BMI of males was higher than their female counterparts. Similarly, BMI was found to increase with age and rising parental education. The mean BMI of adolescents having Post-Graduate parents was 21.78 kg/m2, whereas the mean BMI was 20.46 kg/m2 for adolescents with Primary educated parents. Parental education is an important proxy indicator of socio-economic status (SES), thereby indicating that BMI increases with rising SES. The mean BMI in the different categories of parental education were compared using one-way Analysis of Variance (ANOVA), but the difference was not statistically significant (p value > 0.05).
| Socio-demographic Variables |
BMI (in kg/m2) | tstat | p value | |
|---|---|---|---|---|
| Mean | SD | |||
| Gender | ||||
| Male | 21.71 | 3.54 | 1.94 | .053 |
| Female | 20.83 | 4.33 | ||
| Age (in years) | ||||
| 16 | 20.39 | 3.71 | 1.825 | .143 |
| 17 | 20.91 | 3.95 | ||
| 18 | 21.89 | 4.23 | ||
| 19 | 20.98 | 3.42 | ||
| Language | ||||
| Guja rati | 21.21 | 3.93 | -1.079 | .281 |
| Others | 22.3 | 3.96 | ||
| Parental Education* | ||||
| Primary | 20.46 | 2.89 | 1.076 | .368 |
| Secondary | 20.31 | 3.37 | ||
| Pre-University | 21.48 | 3.40 | ||
| Graduate | 21.12 | 4.04 | ||
| Post Graduate | 21.78 | 4.30 | ||
* This was categorised into five categories; Primary (upto class 8th), Secondary (upto class 10th), Pre-university (upto class 12th), Graduate and Post-graduate.
The BMI-for-age of the study participants was compared with the WHO 2007 BMI-for-age growth charts (Table 3). It was found that 10.3% of the adolescents were overweight, 4.3% were obese and 9.0% were underweight. No significant association was found between gender and any of the BMI- for-age categories according to WHO 2007 criteria. This indicates that nearly equal proportions of males and females were present in each of the BMI categories.
| Interpretation | Males | Females | Total | OR | χ2 value | p value |
|---|---|---|---|---|---|---|
| Normal | 125 (79.6) | 104 (72.7) | 229 ( 76.3) | 1.463 | 2.335 | .505 |
| Overweight: >+1SD | 15 (9.5) | 16 (11.2) | 31 (10.3) | 0.839 | ||
| Obesity: >+2SD | 5 (3.2) | 8 (5.6) | 13 (4.3) | 0.556 | ||
| Thinness: <-2SD | 12 (7.6) | 15 (10.5) | 27 (9.0) | 0.707 | ||
| Total | 157 | 143 | 300 |
The BMI-for-age of the study participants was also compared with the CDC 2000 BMI-for-age growth charts (Table 4). Using WHO classification above, the prevalence of underweight was 9% which increased to 22.6% using CDC 2000 growth charts. The finding of no significant association between gender and any of the BMI-for-age categories demonstrated earlier (Table 3) was also replicated by using CDC 2000 criteria.
| Interpretation of cut-offs | Males | Females | Total | OR | χ2 value | p value |
|---|---|---|---|---|---|---|
| Normal-5th to <85th | 109 (69.4) | 90 (62.9) | 199 (66.3) | 1.411 | 1.956 | .581 |
| Overweight: 85th to 95th | 10 (6.4) | 13 (9.1) | 23 (7.6) | 0.783 | ||
| Obesity: =95th | 4 (2.5) | 6 (4.2) | 10 (3.3) | 0.223 | ||
| Thinness: <5th | 34 (21.7) | 34 (23.7) | 68 (22.6) | .1919 | ||
| Total | 157 | 143 | 300 |
As shown in Figure 1 the proportion of normal BMI identified by WHO standards was higher than that identified by CDC standards and this difference was found to be statistically significant. Similarly, the proportion of underweight identified by the CDC charts was significantly higher than that of WHO charts.
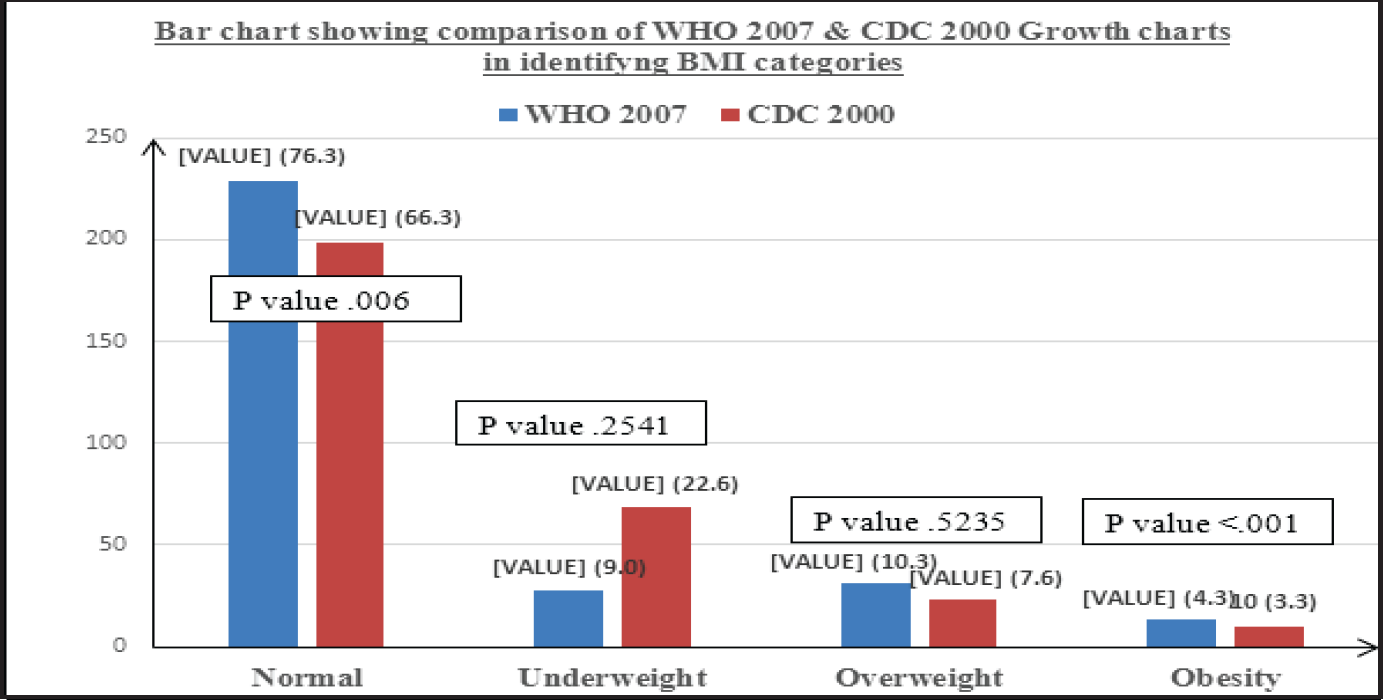
- Comparison of CDC 2000 and WHO 2007 BMI-for-age charts in study participants
Discussion
Obesity and its determinants are well identified by a plethora of scientific literature, beginning from the findings of the Framingham Heart Study in the 1960s. A systematic review done in 2016 in India reported that overweight and obesity rates in children and adolescents are increasing not just among the higher socio-economic groups but also in the lower income groups where underweight still remains a major concern(9). A similar study done by Alok et al from Western India in 2012 reported the prevalence of overweight 25.8% and obesity 12.8%(8). This is much higher than the 10.3% overweight and 4.3% obesity prevalence in the current study. The difference might be because of difference in standards used: IOTF (International Obesity Task Force)- Cole 2000(10) versus WHO 2007. A study done by Gupta et al(11) in 2013 from Bankura, West Bengal using WHO standards reported prevalence of overweight 7.7% and obesity 4.0%. The findings are comparable to the current study. However, Gupta et al reported higher prevalence in males than females, whereas the current study identified higher prevalence in females. In the 2013 study done by Moitra et al (12) in the same setting, overall prevalence of overweight and obesity was 10.3% and 5.9%, respectively and the prevalence was higher in boys in comparison to the girls. Although this sex differential was not found by current study, the prevalence estimates are somewhat similar as both the studies used WHO standards.
Another study from South India(13) reported that the prevalence of overweight and obesity in the study population was 9.7% and 4.3%, respectively but there was no difference in prevalence between males and females. Kotian et al (2010) reported that the prevalence of overweight among adolescents varies between 10 and 30%(14). Regional variations in patterns of obesity are also documented with Northern and Eastern India reporting higher prevalence in comparison to Western and Southern India.(9)
Current study shows that BMI increases as the parental education rises. This finding is similar to previous studies done in developing countries, but is reverse to the findings from developed countries. Goyal et al in their study from Ahmedabad(15)used family income as a proxy of SES and reported that prevalence of overweight among children was higher in middle SES as compared to higher SES group in both the gender. Hence, the relation between SES and obesity is not linear as conventionally understood. In line with previous research, socio-economic status was assessed by using the proxy of parental education level(16). We could not demonstrate a significant relation between BMI and parental education in our study, as education might not be perfect proxy of socio-economic status in Indian set-up.
For any given population, WHO-BMI z-scores associates with increased percentage of obese and reduced percentage of under-weight when compared to CDC-BMI z-scores(17). This finding was also demonstrated by the current study. It was also found that the prevalence of underweight was 5.9% by WHO standards which increased to 19.8% using CDC 2000 growth charts. This is because both criteria have different base populations(18). WHO charts are more representative of growth patterns in our study population because it is based on a much more diverse and representative sample.
Conclusion and Recommendations:
As demonstrated by the current study, overweight and obesity is equally prevalent in both the genders and in all SES groups. Early Interventions need to be directed at adolescent and younger population irrespective of gender or SES in order to prevent the epidemic of non-communicable diseases from taking a serious magnitude in the future. Further studies should be done to collect more nationally comparable data on overweight and obesity using uniform criteria and standards. In the absence of a nationally validated growth standard, the WHO 2007 standards can be used as the common yardstick for comparing obesity statistics throughout the country.
Limitations:
Although great care was taken to include adolescents who differed in age, gender, and socio-economic status, our study was conducted with a convenience or purposive sample which made the participants very homogeneous with respect to demographic variables. Also, the current study is a cross-sectional study, which yields only limited information in comparison to longitudinal studies, as far as growth and development is concerned.
Conflict of Interest:
None
How to cite this article: Manna S, Chauhan N T, Assessment of Obesity among Adolescents from an Urban Area of Western India. J Comprehensive Health 2020:8(1): 34-38.
Funding:
None
References:
- National Family Health Survey - 4 District Fact Sheet Surat Gujarat. 2015. http://rchiips.org/nfhs/FCTS/GJ/GJ_FactSheet_492_Surat.pdf. (accessed )
- [Google Scholar]
- Physical and sexual growth pattern of affluent Indian children from 5 to 18 years of age. Indian Pediatr. 1992;29(10):1203-82.
- [Google Scholar]
- Physical growth in Indian affluent children (birth-6 years) Indian Pediatr. 1994;31(4):377-413.
- [Google Scholar]
- IAP growth monitoring guidelines for children from birth to 18 years. Indian Pediatr. 2007;44(3):187-97.
- [Google Scholar]
- Defining obesity risk status in the general childhood population : Which cut-offs should we use ? Int J Pediatr Obes. 2010;5:458-60.
- [CrossRef] [PubMed] [Google Scholar]
- The challenge of childhood obesity. International Journal of Pediatric Obesity. 2006;1:7-10.
- [CrossRef] [PubMed] [Google Scholar]
- Recommendations. National Workshop on Adoption of New WHO Child Growth Standards, New Delhi, India. 2007 February 8-9
- [Google Scholar]
- Prevalence of Overweight & Obesity in Adolescents of Urban & Rural Area of Surat, Gujarat. Natl J Med Res. 2012;2(3):325-9.
- [Google Scholar]
- Epidemiology of childhood overweight & obesity in India: A systematic review. Indian J Med Res. 2016;143:160-74.
- [CrossRef] [PubMed] [Google Scholar]
- Establishing a standard definition for child overweight and obesity worldwide: International survey. Br Med J. 2000;320(7244):1240-3.
- [CrossRef] [PubMed] [Google Scholar]
- Prevalence of lifestyle associated cardiovascular risk factors among adolescent students of Rural Bengal Avisek. J Integr Heal Sci. 2013;1(2):69-75.
- [CrossRef] [Google Scholar]
- Prevalence of obesity and overweight in school going adolescents of Surat city, Gujarat , India. Int J Med Sci Public Heal. 2015;4(1):42-7.
- [CrossRef] [Google Scholar]
- Prevalence of overweight and obesity among adolescent students in Pondicherry , South India. Int J Nutr Pharmacol Neurol Dis. 2016;6(2):72-5.
- [CrossRef] [Google Scholar]
- Prevalence and determinants of overweight and obesity among adolescent school children of South karnataka, India. Indian J Community Med. 2010;35(1):176-8.
- [CrossRef] [PubMed] [Google Scholar]
- Prevalence of overweight and obesity in school going children of Ahmedabad city: Its relationship with socioeconomic status and associated lifestyle factors. J Assoc Physicians India. 2011;58:151-8.
- [Google Scholar]
- Methodology on the My World Survey (MWS): A unique window into the world of adolescents in Ireland. Early Interv Psychiatry. 2013;7(1):12-22.
- [CrossRef] [PubMed] [Google Scholar]
- Prevalence of obesity among Portuguese children (6-8 years old) using three definition criteria: COSI Portugal, 2008. Pediatr Obes. 2012;7(6):413-22.
- [CrossRef] [PubMed] [Google Scholar]
- Comparison between CDC and WHO BMI z-score and their relation with metabolic risk markers in Northern Portuguese obese adolescents. Diabetol Metab Syndr [Internet]. 2015;7(1):1-5.
- [CrossRef] [PubMed] [Google Scholar]