Translate this page into:
Forecasting Dengue Incidence in Tamil Nadu, India: An Time series Analysis
Corresponding author: Dr. R Karnaboopathy, Assistant Professor cum Statistician, Department of Community Medicine, Shri Sathya Sai Medical College and Research Institute, Ammapettai village, Kancheepuram. PIN- 603108. E-mail: statrkboopathy@gmail.com
-
Received: ,
Accepted: ,
How to cite this article: Karnaboopathy R, Venkatesan D, Manikandan M, Muthukumar T, Raja D, and Jegadeesh Ramasamy D. Forecasting Dengue Incidence in Tamil Nadu, India: An Time series Analysis.J Comprehensive Health.2018; 6(2):62-66.
Abstract
Background:
The incidence of dengue has grown dramatically around the world in recent decades. As per World Health Organization (WHO) recent estimates, 390 million dengue infections occur per year, of which 96 million manifest clinically. India had reported a total of 1,57,220 dengue cases and 250 deaths during the year 2017. Maximum number of cases (23,035) and deaths (63) due to Dengue were reported in Tamil Nadu. Dengue cases in Tamil Nadu have risen nearly 10 times and deaths due to the disease 12 times compared with last year.
Methods:
We adopted an Auto Regressive Integrated Moving Average (ARIMA) models on the data collected from 1997 to 2017. The data has been used to predict the number of cases till December 2025 without any additional intervention.
Results:
The results also showed an increasing trend in the actual and forecasted numbers of Dengue cases. The appropriate ARIMA (0, 1, 1) model was selected based on Bayesian Information Criteria (BIC) values.
Conclusions:
Hence, to prevent the disease from getting established as an endemic in Tamilnadu, additional interventions with an increase in the intensity of existing interventions and support of the international community along with WHO is essential to stop the epidemic.
Keywords
Time series model
Dengue
ARIMA
BIC
Forecasting.

Introduction:
The incidence of dengue has grown dramatically around the world in recent decades. As per World Health Organization (WHO) recent estimates, 390 million dengue infections occur per year, of which 96 million manifest clinically. WHO also estimates that 3.9 billion people, in 128 countries, are at risk of infection with dengue. An estimated 500 000 people with severe dengue require hospitalization each year, and about 2.5% of those affected die. India had reported a total of 1,57,220 dengue cases and 250 deaths during the year 2017.
Maximum number of cases (23,035) and deaths (63) due to Dengue were reported in Tamil Nadu. Dengue cases in Tamil Nadu have risen nearly ten times and deaths due to the disease 12 times compared with last year.(1-3)
Current dengue prevention strategies are weak as they are reactive rather than anticipatory. Detailed information about when and where Dengue outbreaks occurred in the past can be a useful guide to the potential magnitude and severity of future epidemics. The outbreaks of Dengue can be predicted by epidemiological modeling thus enabling the health systems to be in readiness to manage outbreaks. Time series analysis has been increasingly used in the field of epidemiological research on infectious diseases, such as influenza, malaria and dengue.(4-5) The present study has been planned to develop a prediction model for Dengue using time series data over the past decade in Tamil Nadu and to forecast the Dengue incidence for the year 2018 onwards.
A time series {Xt,= 1,2.,,,,,N} is "a sequence of observed data, usually ordered in time" where t is a time index, and N is the number of observations. Researchers study systems as they evolve through time, hoping to discover their underlying principles and develop models useful for predicting or controlling them. Traditional time series analysis methods such as the Box-Jenkins or Autoregressive Integrated Moving Average (ARIMA) method can be used to model such time series. However, the ARIMA method is limited by the requirement of stationarity of the time series, normality and independence of the residuals. Residuals are the errors between the observed time series and the model generated by the ARIMA method. The residuals must be uncorrelated and normally distributed.
The main objective in the fitting ARIMA model is to identify the stochastic process of the time series and predict the future values accurately. These methods have also been useful in many types of situations which involves the building of models for discrete time series. In the present study, time series model was used to forecast the trend in number of dengue cases reported in Tamilnadu.
Methods:
Auto regressive integrated moving average (ARIMA) model was fitted with the data available during 1997 to 2017. In 1968, George Box and Gwilym Jenkins have broadly studied ARIMA models and their names have frequently been used synonymously with general ARIMA process applied to time series analysis, forecasting and control.[6]
Autoregressive (AR) models can be effectively joined with Moving Average (MA) models to form a general and useful class of time series models called Autoregressive Moving Average ARMA (p, q) models. However, they can only be used when the data are stationary. When a time series is studied based on the confidence relationship between the time- lagged values of the forecast variance and the past error terms, an Autoregressive Integrated Moving Average (ARIMA) model is more suitable and it can be used when the time series is non-stationary.
The general form of the ARIMA (p, d, q) model is, Yt = α0 + α1 Yt-1 + α2 Yt-2 + ... αp Yt-p + β1 et-1 + β2 et-2 + ... βq et-q + et
Where Yt and et are actual and random error at time period t, respectively; p, d and q represent the order of autoregressive part, the degree of differencing involved and the order of the moving average part. Random error, et independently and identically distributed (i. i. d) random variable with mean zero and variance (σ2).[7-9]
Generally, ARIMA models consist of four stages:
Identification of the model: This involves selecting the most appropriate lags for the AR and MA parts, as well as determining if the variable requires first-differencing to induce stationary. The Auto Correlation Function (ACF) and Partial Auto Correlation Function (PACF) are used to identify the best model.
Estimation: This usually involves the use of a least squares estimation process.
Diagnostic testing: This usually is the test for autocorrelation. If this part fails, then the process returns back to the identification section and begins again, usually by the addition of extra variables.
Forecasting: The ARIMA models are particularly useful for forecasting due to the use of lagged variables.
An ARIMA model can be obtained at first by determining its parameters. The values of p and q can be determined from the patterns in the plotting of the values of ACF and PACF. The spikes falling above the time axis are used to estimate the value of p. The spikes falling below the time axis are used to estimate the value of q. For an AR (p) model, the spikes of ACF decay exponentially or there is a sine wave pattern and the spikes of PACF are close to zero beyond the time lag p. For a MA (q) model the spikes on the ACF end to zero beyond the time lag q whereas the spikes of PACF decay exponentially or there is a sine wave pattern.(10,11)
Once the model was identified and model parameter can be estimated, then the model is determined with a different set of parameters. It is basically checked with the assumption that the model about the random error et is satisfied. This can be identified as several diagnostic statistical measures and plots of the residuals can be used to examine the goodness of fit of different models to the historical data. The model selection can be made based on the values of certain criteria like Normalized Bayesian Information Criteria (BIC).
Result:
Data regarding the number of cases severely affected in dengue in Tamilnadu data were collected from National vector borne disease control program (NVBDC). This data were plotted on a graph to see the trend in Figure 1.
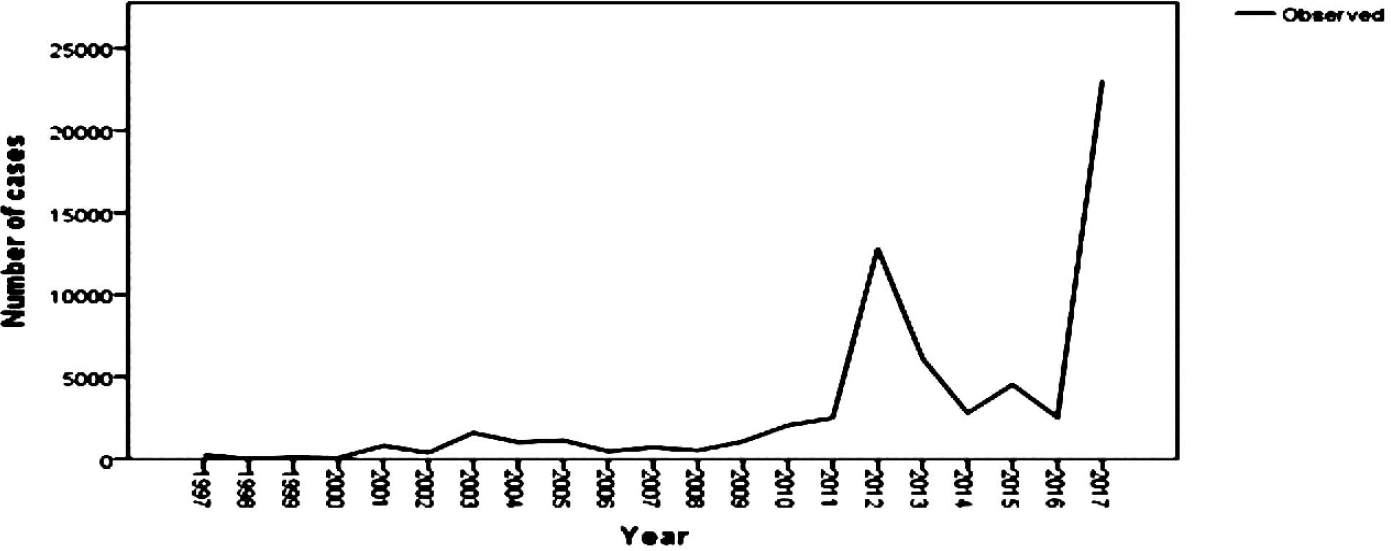
- No. of dengue cases during the period of 1997-2017
Auto Correlation Function (Figure 2) and Partial Auto Correlation Function (Figure 3) showed that an irregular increasing pattern in the number of cases of dengue. Henceforth, ARIMA models (p, d, q), for such scenario was applied. The best suitable model was selected based on minimal Bayesian Information Criteria (BIC) value. In this study, the least BIC value is 17.21 (Table 1) and the corresponding model is ARIMA (0, 1, 1) with goodness of fit (R2=30%). The model verification is done by checking the residuals of the model (Figure 4). This is done through examining the autocorrelation and correlation of the residuals of various orders.
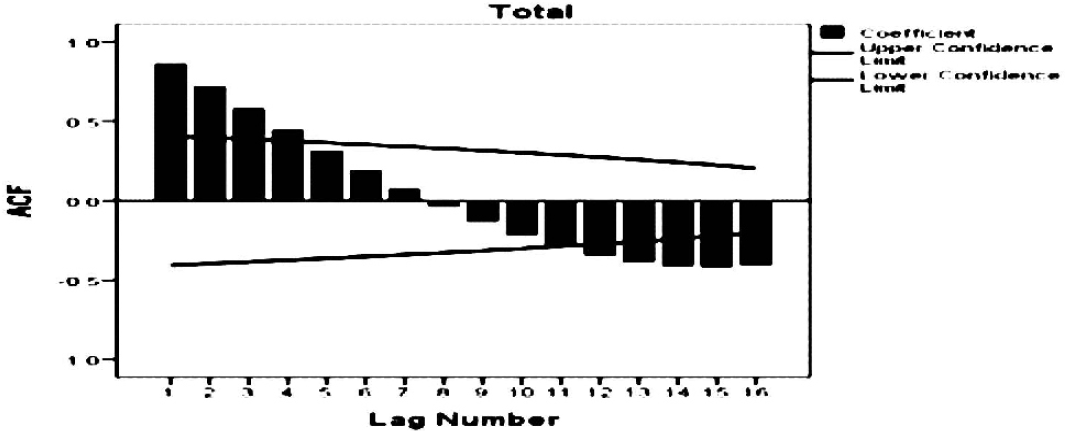
- Auto correlation function (ACF)

- Partial auto correlation function (PACF)

- Residual ACF and PACF
| ARIMA (p, d, q) | BIC | R-Squared |
|---|---|---|
| 1, 1, 1 | 17.41 | 0.31 |
| 1, 1, 2 | 17.61 | 0.32 |
| 0, 1, 1 | 17.21 | 0.30 |
| 1, 1, 0 | 17.47 | 0.10 |
| 0, 1, 0 | 17.36 | 0.01 |
The forecasted values for 2018 to 2025 were in proximity to the actual values (Figure 5 and Table 2) and there by the validity of the model were ensured.
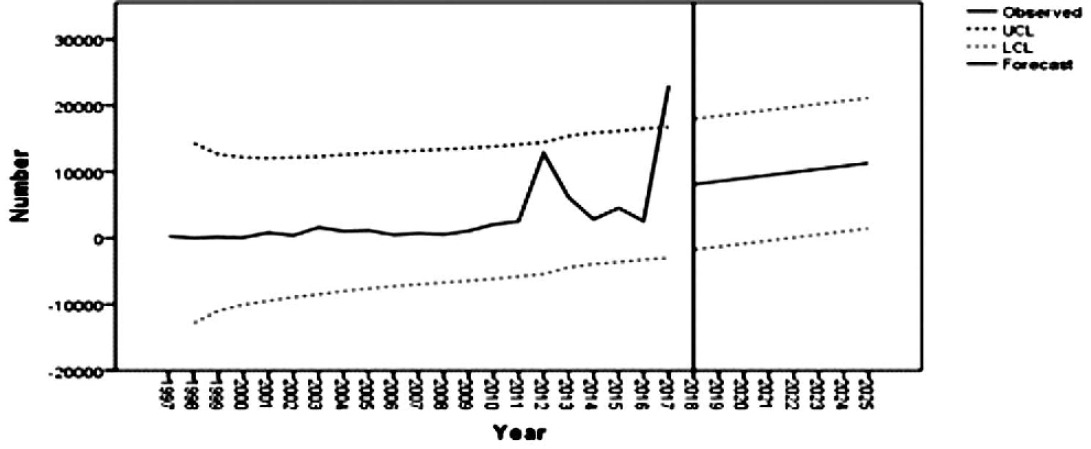
- Actual and forecasted cases
| Year | Actual no. of cases | Forecasted no. of cases | 95 % confidence Interval | |
|---|---|---|---|---|
| Lower limit | Upper limit | |||
| 1997 | 264 | - | - | - |
| 1998 | 33 | 721 | -12899 | 14340 |
| 1999 | 135 | 834 | -10961 | 12628 |
| 2000 | 81 | 1057 | -10063 | 12178 |
| 2001 | 816 | 1270 | -9497 | 12037 |
| 2002 | 392 | 1636 | -8914 | 12185 |
| 2003 | 1600 | 1885 | -8517 | 12287 |
| 2004 | 1027 | 2301 | -7994 | 12597 |
| 2005 | 1142 | 2599 | -7616 | 12813 |
| 2006 | 477 | 2893 | -7258 | 13045 |
| 2007 | 707 | 3108 | -6992 | 13209 |
| 2008 | 530 | 3347 | -6712 | 13406 |
| 2009 | 1072 | 3569 | -6455 | 13592 |
| 2010 | 2051 | 3833 | -6161 | 13827 |
| 2011 | 2501 | 4163 | -5806 | 14131 |
| 2012 | 12826 | 4509 | -5438 | 14455 |
| 2013 | 6122 | 5485 | -4442 | 15412 |
| 2014 | 2804 | 5979 | -3930 | 15889 |
| 2015 | 4535 | 6260 | -3635 | 16154 |
| 2016 | 2531 | 6626 | -3255 | 16506 |
| 2017 | 23065 | 6878 | -2991 | 16746 |
| 2018 | - | 8105 | -1752 | 17962 |
| 2019 | - | 8562 | -1295 | 18419 |
| 2020 | - | 9018 | -838 | 18875 |
| 2021 | - | 9475 | -380 | 19330 |
| 2022 | - | 9932 | 79 | 19784 |
| 2023 | - | 10389 | 538 | 20239 |
| 2024 | - | 10845 | 998 | 20693 |
| 2025 | - | 11302 | 1457 | 21147 |
Discussion:
As early mentioned above ARIMA model consist of four steps, the first step was the identification of the model. The model identification done by ACF and PACF (Fig 2 & 3), it exposed increasing pattern in the number of cases of Dengue. Model parameters were estimated using SPSS ver. 23.0. In the forthcoming years (2018 to 2025), the model predicted and gradually increased in the no.of dengue cases. The outbreak, which started with 264 cases in 1997, is expected to increase 43 folds in the year 2025. This implies that the existing interventions in our state will not be adequate to control the on-going epidemic even in another 8 years. Based on the forecasting model and assuming the current conditions of the dengue fever outbreak in Tamil nadu remains as in the earlier period, it is expected to increase in the number of dengue cases. In order to control the outbreak of Dengue cases, it should be take actions and interventions to avoid more cases and deaths.
Conclusion:
In this study, forecasting methods were applied to predict the number of Dengue cases in Tamil nadu based on yearly cases reported by NVBDC. Model prediction was done using ARIMA models in which the appropriate model was identified using minimum BIC value. The trend in forecasted values 2018 to 2025 reveals that there is a stable increase in the number of cases of Dengue which is of serious concern. Hence, to prevent the disease from getting established as an endemic, additional interventions with an increase in the intensity of existing interventions and support of the international community along with WHO is essential to stop the epidemic.
Conflict of Interest:
None declared
Source of support:
Nil
References:
- World Health Organization. (updated on April 2017) Available from: http://www.who.int/mediacentre/factsheets/fs117/en/ (accessed )
- [Google Scholar]
- Forecasting incidence of dengue in Rajasthan, using time series analyses. Indian J Public Health. 2012;56:281-5.
- [CrossRef] [PubMed] [Google Scholar]
- Forecasting dengue incidence in Dhaka, Bangladesh: A time series analysis. Dengue Bull. 2008;32:29.
- [Google Scholar]
- Time series analysis of dengue incidence in Rio de Janeiro, Brazil. Am J Trop Med Hyg. 2008;79:933-9.
- [CrossRef] [PubMed] [Google Scholar]
- Temporal patterns and forecast of dengue infection in Northeastern Thailand. Southeast Asian J Trop Med Public Health. 2008;39:90-8.
- [Google Scholar]
- Development of temporal modelling for forecasting and prediction of malaria infection susing time-series and ARIMAX analyses: A case study in endemic districts of Bhutan. Malaria Journal. 2010;9:251.
- [CrossRef] [PubMed] [Google Scholar]
- Forecasting Areas and Production of Rice in India using ARIMA model. International Journal of Farm Sciences. 2014;4(1):99-106.
- [Google Scholar]
- Time series forecasting using a hybrid ARIMA and neural network models. Neurocomputing. 2003;50:159.
- [CrossRef] [Google Scholar]
- Forecasting Dengue Hemorrhagic Fever Cases in Southern Thailand using ARIMA Models, Dengue Bulletin. . 2006;30:99-106.
- [Google Scholar]
- Distribution of residual autocorrelations in autoregressive- integrated Moving average time-series models. J Am Stat Ass. 1970;65:1509.
- [CrossRef] [Google Scholar]
- Time Series Analysis: Forecasting and Control. (2nd). San Francisco: Holden-Day; 1976. p. :575.
- [Google Scholar]