Translate this page into:
Complimentary feeding practices amongst tribal and non-tribal population of Assam
CORRESPONDING AUTHOR: Dr Tulika Goswami Mahanta, Professor and HOD, Community Medicine, Assam Medical College, Dibrugarh, Pin 786001 E Mail ID: drtulikagoswami@gmail.com
-
Received: ,
Accepted: ,
CITATION: Mahanta TG, Ronghangpi P, Baruah M, Baruah SD. Complimentary feeding practices amongst tribal and non-tribal population of Assam. J Comp Health. 2022;10(1):04-13. Doi: https://doi.org/10.53553/JCH.v10i01.002
Abstract
Problem statement:
Less than half of Indian infants aged 6-9 months receive some kind of complementary foods in addition to mother's milk and only 1 child in 10, between 6-24 months is fed optimally, i.e. fed as per the recommended practices.
Objective:
To assess and compare the complimentary feeding practices amongst tribal and non-tribal population of Assam.
Methods:
A community based cross-sectional observation study. A total of 300 mothers from ‘Tribal and Non-Tribal’ were interviewed using WHO recommended study tools. Data analysis was done using SPSS Version 20. Chi-square test was done to see association between two variables. Binary logistic regression was done to find odds ratio. p<0.05 were considered statistically significant.
Results:
Response rate was 93% (560/600). Mean age of initiation of complementary feeding was 7 months. Delay in initiation of complementary was seen more in non-tribal population than tribal population (64.1% vs 57.9%). Early initiation of breastfeeding was overall 79.3% (81.1% tribal vs 77.3% non-tribal). Colostrum was given in majority (44.6% tribal vs 44.5% non-tribal) which was found to be significantly different (p= 0.001). Normal weight was significantly higher in tribal than non-tribal community (90.5% vs 81.1%) (p=0.003).
Conclusion:
Health education and demonstration of complementary diet with locally available homemade ingredients may increase care giver's knowledge and enhance complementary feeding practices.
Keywords
Complimentary feeding practices
Tribal population
non-tribal population
Assam
Young infant and child feeding (IYCF) practices

INTRODUCTION
First 1000 days of life, period between woman's pregnancy (270 days in-utero, childbirth till second birthday, identified as the best opportunity for establishing optimum growth and development.[1] WHO/ UNICEF have emphasized importance of optimal Infant and young child feeding (IYCF) practices from birth to 2 years of age also known as “critical window”.[2] Optimal IYCF practices and its impact on health and economy is often underestimated in comparison to disease specific interventions and advances in technologies and pharmaceuticals at all levels.[3] Despite strong evidence on benefit of IYCF, inappropriate IYCF practices have been widely documented in low-and middle-income countries. Some study done in other part of World showed Mothers' knowledge on infant and young child feeding recommendation was very low while nutrition during this period, cornerstone for building a generation of healthy, highly intellectual and productive nation.[4,5] WHO has recommended timely initiation of complementary feeding at 6 months with continued breastfeeding.[6] Optimal IYCF practices is the most cost effective intervention capable of delivering universal health coverage with best nutrition to the most vulnerable population irrespective of economic condition, can significantly increase effectiveness of immunization, can avert most common causes of infant and under5 mortality, can prevent future development of chronic diseases such as obesity and related co-morbidities and prevent breast and ovarian cancers, depression among women.[7,8]
The status of complementary feeding in India is very poor with total children age 6-23 months receiving an adequate diet standing at 9.6 %. The state of Assam is still poorer than India at 8.9%. The interventions in IYCF have shown results through increased percentage of breast feeding but the complementary feeding part was neglected. Therefore, this study was undertaken to assess the complimentary feeding practices in Assam and to compare the difference in knowledge and practice of complimentary feeding amongst tribal and non-tribal population of Assam.
MATERIAL & METHODS
A community based cross-sectional observational study was conducted in one tribal and another non tribal dominated block of Assam by stratified Random Sampling. Study population were mothers or primary care givers of children aged between 6-12 months.
Sample size and sampling procedures:
WHO recommended sample size and sampling technique was followed to select the study participants (pair of children of 6-12 months and their mothers) for the study assuming 50% proportion with 10% relative precision and 90% confidence level the required sample size is 269, which is inflated to 300 considering 10% non-response rate and rounding up. [9] A total of 300 mothers from each of the community ‘Tribal and Non-tribal’, who have delivered live-born babies in last 6-12 months, were planned to interview using WHO recommended study tools.
Sampling frame of children of 6-12 months residing in the area was prepared using the ECCRs (Eligible couple & Child Registers) and updated registers of households in the area, available with the health workers of each village of the selected Block.
Study tool:
This study followed the WHO and UNICEF recommended IYCF indicators which reflects current guidance on breastfeeding, complementary feeding. [9] Minimum dietary diversity was defined as proportion of children 6-12 months of age who receive foods from 4 or more food groups and minimum meal frequency was defined as proportion of breastfed and non-breastfed children 6-12 months of age who receive solid, semi-solid, or soft foods the minimum number of times or more, while minimum acceptable diet was considered as proportion of children 6-23 months of age who receive a minimum acceptable diet (apart from breast milk).[9] All service providers of ICDS i.e., Anganwadi workers of the study area were also assessed for their knowledge and practice regarding complimentary feeding practices. A pre-designed, pretested formats were used for data collection on socio-demographic profile, IYCF practices and availability and utilization of common kitchen garden products for preparation of complimentary food. Anthropometric examination was done by using SECCA scale for weight, length, mid arm circumference. The indices like underweight, wasting and stunting were used for assessment of nutritional status.
Ethical consideration:
Institutional ethical clearance was obtained before enrolment of study participants. Written informed consent was taken from all study participants.
Statistical analysis:
The data were entered using Kobo Toolbox in the field. Further the analysis was done by using SPSS (Version20). The comparison of complementary feeding practices between Tribal and Non-tribal community and other factors were analysed by using Chi-Square statistics. The overall prevalence Odds were determined to quantify the risk among 6-12 months of children. For finding Odds ratio, Binary Logistic Regression technique was used. The results were considered to be statistically significant at p ≤0.05.
RESULTS
A total of 560 children (6-12 months) participated in the study with a response rate of 93% (560/600). Proportion wise allocation was 296 tribal and 264(53% vs 47%) non tribal children were enrolled in the study. The average income of the studied population was INR 14,105 (8120 vs 11970 amongst tribal and non-tribal population). According to BG Prasad socioeconomic classification majority (44%) were in class I in tribal population, while in non-tribal majority (35%) were in class II. Boy child outnumber girl child (53 vs 47) and 29% children aged between 6-8 months while 71% were between 9-12 months of age with an average age of 10 months (±2 months). Average age of mothers at the time of marriage was 22 years of which 16.3% got married before 18 years of age. Average age of mother at first pregnancy was 22 years of which 27.7% were adolescent pregnancy. Majority of study participants were Hindu by religion 96.2(%). Type of family was nuclear in 42% (39.5% vs 44.7%), while 58% (60.5% vs 55.3%) hailing from joint family. Average size of family is same (6) in both tribal and non-tribal community. Majority of children were of first order 56% (55.4% vs 56.8%), followed by second order 36% (34.5% vs 37.5), while only 8% were third order or above (7.1 % vs 4.5%).
Mean age of start of complimentary feeding was 7 months (7months vs 6months). Age of initiation of complimentary feeding was at 6 month was seen in 36.9% (40.2% in tribal vs 32.7% in non-tribal) population, while majority did delay initiation 60.6% (57.9% in tribal vs 64.1% in nontribal) population. Majority of non-tribal population (69.5%) do ceremonial start of complimentary feeding while 55.1% tribal do ceremonial start, while 38.2% do not do any ceremonial start (44.9% vs 30.5%) which is significantly different in both the groups (p=0.001). Majority of babies received biscuit 51.2% as complimentary food (49.2% in tribal and 53.4% in nontribal population (p=0.649). While nutritionally superior, cheap, locally available, culturally acceptable Khichri (rice, cereal, vegetables) was seen in 48% cases. Uses of commercial product, like Cerelac was high in non-tribal (7.1% tribal vs 19.3% in non-tribal, p=0.000). Rice gruel was another most commonly used complimentary food in both the groups (41.7% in tribal vs 41.3% in non-tribal, p=0.927). Similarly, banana which is very commonly available in both the locality used as complimentary food in 44.9% in tribal and 30.5% amongst non-tribal community (p=0.084). Majority do separate cooking of complimentary food for the child (66.2%) which is significantly higher in non-tribal compared to tribal (54.7% in tribal and 79.4% in non-tribal (p=000). Though majority of mother/ care giver wash their hands before feeding their child (89.1%) (86.2% in tribal vs 92.4% in non-tribal), while 10.9% still not practice hand washing (13.8% in tribal vs 7.6% in non-tribal), which is significantly different in both the groups (p=0.006). Tasting of food before offering to child was practiced by majority (79.5%) mother which is higher in tribal compared to non-tribal population (83.5% vs 74.9%), while 20.5% do not taste the food i.e., 16.5% in tribal vs 25.1% in non-tribal population, which is significantly different (p=0.021). Active feeding was seen in 82.2% (80.7% in tribal vs 83.9% in non-tribal, p=0.37). Feeding was done by using spoon in 60.8%, which is significantly higher amongst non-tribal (53.9% vs 68.6%, p=0.001). Source of water for preparation of complimentary food and consumption was tube well (92%) in most of the cases (99.2% vs 83.9%, p=0.000). [Table 1]
| Variable | Comment | Overall (n=560) | Tribal (n=296) | Non-tribal (n=264) | Chi-square | p-value | |||
|---|---|---|---|---|---|---|---|---|---|
| Frequency | % | Frequency | % | Frequency | % | ||||
| CF started | Yes | 477 | 85.2 | 254 | 85.8 | 223 | 84.5 | 0.199 | 0.656 |
| No | 83 | 14.8 | 42 | 14.2 | 41 | 15.5 | |||
| Age of first CF started | <6 months | 12 | 2.5 | 5 | 2 | 7 | 3.1 | 0.267 | 0.605 |
| =6 months | 176 | 36.9 | 102 | 40.2 | 73 | 32.7 | 2.816 | 0.093 | |
| >6 months | 289 | 60.6 | 147 | 57.9 | 143 | 64.1 | 1.947 | 0.163 | |
| Procedure of starting 1st CF (n=477) | After a ceremony | 295 | 61.8 | 140 | 55.1 | 155 | 69.5 | 10.418 | 0.001 |
| No ceremony | 182 | 38.2 | 114 | 44.9 | 68 | 30.5 | |||
| Name of first semi solid/solid foods baby received | Banana | 127 | 26.6 | 78 | 30.7 | 49 | 22 | 4.962 | 0.084 |
| Rice gruel | 198 | 41.5 | 106 | 41.7 | 92 | 41.3 | 0.152 | 0.927 | |
| Khichdi | 229 | 48 | 121 | 47.6 | 108 | 48.4 | 0.142 | 0.931 | |
| Bread | 7 | 1.5 | 6 | 2.4 | 1 | 0.4 | 3.161 | 0.206 | |
| Biscuit | 244 | 51.2 | 125 | 49.2 | 119 | 53.4 | 0.864 | 0.649 | |
| Cerelac | 61 | 12.8 | 18 | 7.1 | 43 | 19.3 | 15.849 | 0.000 | |
| Others | 108 | 22.6 | 53 | 20.9 | 55 | 24.7 | 1.248 | 0.536 | |
| Separately cooked (n=477) | Yes | 316 | 66.2 | 139 | 54.7 | 177 | 79.4 | 32.263 | 0.000 |
| No | 161 | 33.8 | 115 | 45.3 | 46 | 20.6 | |||
| Does mother/care giver wash hand before giving food to child | Yes | 425 | 89.1 | 219 | 86.2 | 206 | 92.4 | 7.450 | 0.006 |
| No | 52 | 10.9 | 35 | 13.8 | 17 | 7.6 | |||
| Does mother taste the food before giving the child | Yes | 379 | 79.5 | 212 | 83.5 | 167 | 74.9 | 5.351 | 0.021 |
| No | 98 | 20.5 | 42 | 16.5 | 56 | 25.1 | |||
| Active feeding | Yes | 392 | 82.2 | 205 | 80.7 | 187 | 83.9 | 0.803 | 0.370 |
| No | 85 | 17.8 | 49 | 19.3 | 36 | 16.1 | |||
| Mode of feeding | By hand | 187 | 39.2 | 117 | 46.1 | 70 | 31.4 | 10.726 | 0.001 |
| By spoon | 290 | 60.8 | 137 | 53.9 | 153 | 68.6 | |||
| Source of water used | Tube well | 439 | 92 | 252 | 99.2 | 187 | 83.9 | 38.804 | 0.000 |
| Water supply | 21 | 4.5 | 0 | 0 | 21 | 9.4 | |||
| Tape water | 6 | 1.3 | 1 | 0.4 | 5 | 2.2 | |||
| Pond | 11 | 2.3 | 1 | 0.4 | 10 | 4.5 | |||
Early initiation of breast feeding (EIBF) was 79.3% amongst studied population (81.1% vs. 77.3%, p=0.267). Minimum meal frequency (MMF) was on 60.5% (42.3% vs 81.1%) while minimum dietary diversity (MDD) 44.4% (43.7% vs 45.3%) and minimum acceptable diet MAD was very low 29.1% (20.5% vs 38.9%). [Figure 1]
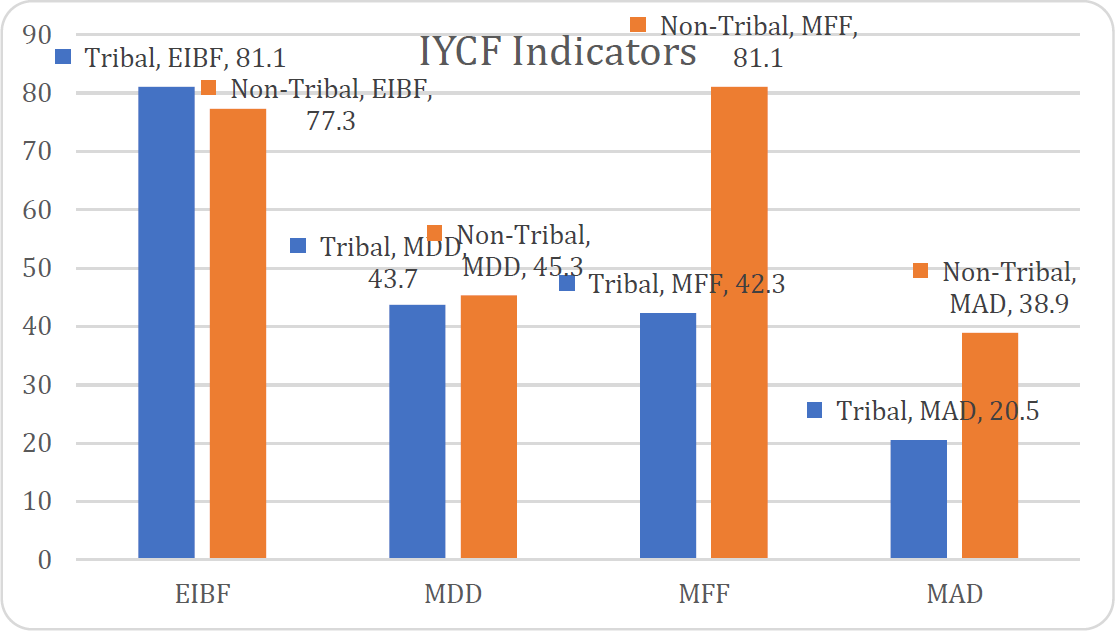
- IYCF INDICATORS FOR COMPLIMENTARY FEEDING AMONGST STUDIED POPULATION
Regarding antenatal check-up, universally the mothers got ANC (99.7% in tribal vs 100% in non-tribal) population. Similarly place of delivery was hospital in majority (50.2% vs 46%, p=0.082). Type of delivery normal in 75% amongst tribal vs 53% non-tribal population, while 25% tribal mothers had LSCS compared to 47% amongst non-tribal which is significantly higher (p=0.000). Most of the children got breast feeding 99.7% in tribal vs 98.9% amongst non - tribal population, only 0.7% tribal and 1.1% non-tribal population had never given breast feeding. Early initiation of breast feeding was found in 81.1% amongst tribal population compared to 77.3% amongst non-tribal population (p=0.267). Commonest reasons for late initiation of breast feeding were, LSCS in majority (61.2%; 71.4% amongst tribal and 51.7% amongst non-tribal) of the studied population. Colostrum was given in majority (44.6% vs 44.5%) which is significantly different (p=0.001). Common reasons for discarding colostrum were elder's advice in majority (36.1% vs 9.8%). On demand breast feeding was given in majority (84.5% vs 94.3%), while night feeding was given by most of the mothers (99.7% vs 98.1%), which is considered as a good IYCF practice. [Table 2]
| Variable | Comment | Overall(n=560) | Tribal (n=296) | Non-tribal (n=264) | Chi-square | p- value | |||
|---|---|---|---|---|---|---|---|---|---|
| Frequency | Percentage | Frequency | Percentage | Frequency | Percentage | ||||
| ANC check-up of mother of child | Yes | 559 | 99.8 | 295 | 99.7 | 264 | 100 | 0.893 | 0.345 |
| No | 1 | 0.2 | 1 | 0.3 | 0 | 0 | |||
| Place of delivery | Home delivery | 21 | 3.8 | 15 | 5.1 | 6 | 2.3 | 3.02 | 0.082 |
| Institution | 539 | 96.2 | 281 | 94.9 | 258 | 97.7 | |||
| Type of delivery | Normal | 361 | 64.6 | 221 | 75 | 140 | 53 | 28.504 | 0.000 |
| Caesarean | 199 | 35.5 | 75 | 25 | 124 | 47 | |||
| Assistance during delivery | Doctor | 467 | 83.4 | 243 | 82.1 | 224 | 84.8 | 0.764 | 0.382 |
| ANM | 74 | 13.2 | 40 | 25 | 34 | 12.9 | 0.049 | 0.824 | |
| ASHA | 9 | 1.6 | 7 | 3 | 2 | 0.8 | 2.280 | 0.131 | |
| Dai | 5 | 0.9 | 4 | 1.4 | 1 | 0.4 | 1.50 | 0.222 | |
| Others | 5 | 0.9 | 2 | 0.7 | 3 | 1.1 | 0.335 | 0.563 | |
| Child ever breastfed | Yes | 556 | 99.3 | 295 | 99.7 | 261 | 98.9 | 1.255 | 0.263 |
| No | 4 | 0.7 | 1 | 0.3 | 3 | 1.1 | |||
| Early initiation of breastfeeding | Yes | 444 | 79.3 | 240 | 81.1 | 204 | 77.3 | 1.232 | 0.267 |
| No | 116 | 20.7 | 56 | 18.9 | 60 | 22.7 | |||
| Reason for late initiation of breast feeding | Caesarean section | 71 | 61.2 | 40 | 71.4 | 31 | 51.7 | 4.764 | 0.029 |
| Unconscious mother | 10 | 8.6 | 5 | 9 | 5 | 8.3 | 0.013 | 0.909 | |
| Discomfort to mothers | 12 | 10.3 | 5 | 9 | 7 | 11.7 | 0.234 | 0.628 | |
| No milk secretion | 7 | 6 | 2 | 3.6 | 5 | 8.3 | 1.158 | 0.282 | |
| Others | 16 | 13.8 | 4 | 7.1 | 12 | 20 | 4.027 | 0.448 | |
| Colostrum given | Yes | 499 | 89.1 | 250 | 44.6 | 249 | 44.5 | 13.973 | 0.001 |
| No | 61 | 10.9 | 46 | 8.2 | 15 | 2.7 | |||
| Reason for discarding colostrum | Elder's advice | 28 | 45.9 | 22 | 47.8 | 6 | 40 | 0.279 | 0.597 |
| Not good for health | 5 | 8.2 | 5 | 10.9 | 0 | 0 | |||
| Child could not suck | 10 | 16.4 | 8 | 17.4 | 2 | 13.3 | 0.136 | 0.712 | |
| Difficult to digest | 5 | 8.2 | 4 | 8.7 | 1 | 6.7 | 0.061 | 0.804 | |
| Others | 13 | 21.3 | 7 | 15.2 | 6 | 40 | 2.714 | 0.257 | |
| Frequency of breastfeeding | On demand | 484 | 86.4 | 259 | 87.5 | 225 | 85.2 | 0.615 | 0.433 |
| Hourly | 66 | 11.8 | 30 | 10.1 | 36 | 13.6 | 1.645 | 0.2 | |
| Others | 10 | 1.8 | 7 | 2.4 | 3 | 1.1 | 1.2 | 0.273 | |
| No | 11 | 6 | 1 | 0.3 | 5 | 1.9 | |||
This study revealed some interesting things about anthropometric data. The proportion of normal weight is significantly (p=0.003) higher in tribal community (90.5%) than the non-tribal community (81.1). underweight was seen in 5.7% cases (3% vs 8.7%). Stunting and wasting is lower in tribal community (7.4% vs 16.7% and 1.4% vs 3.4%). [Table 3] [Figure 2]
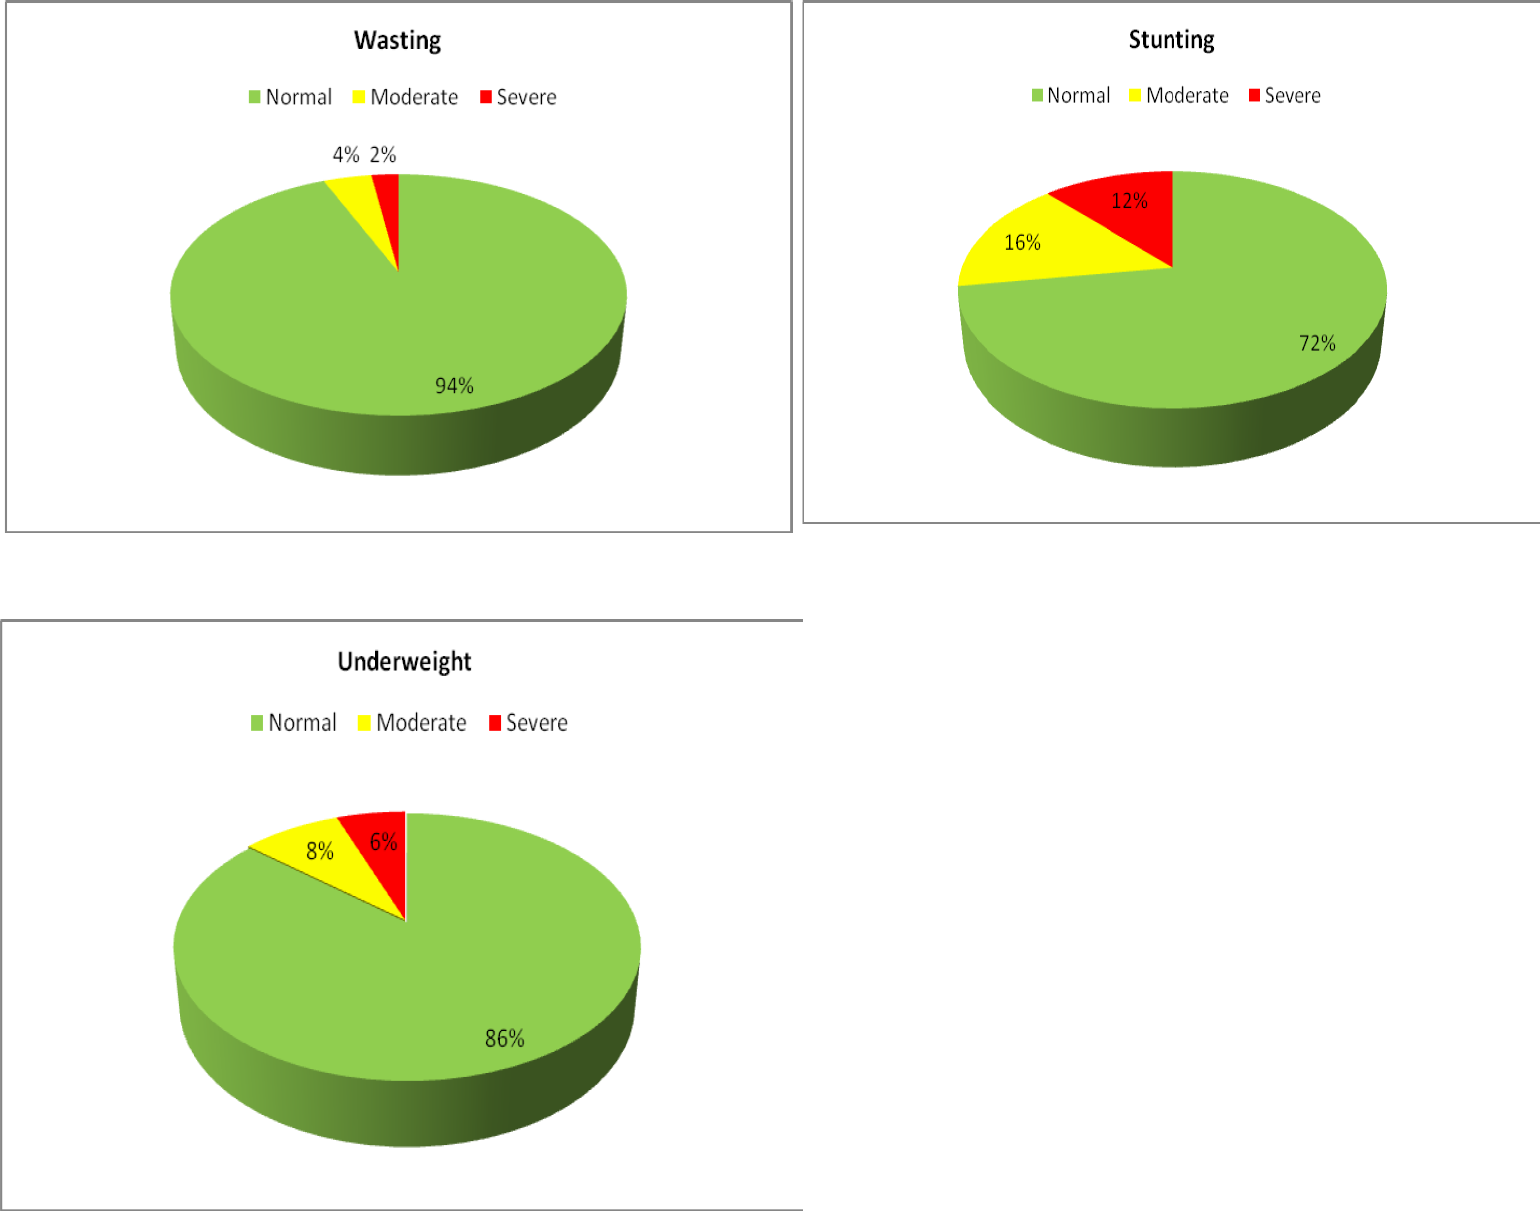
- NUTRITIONAL STATUS OF CHILDREN IN TRIBAL AND NON-TRIBAL COMMUNITY
| Variable | Comment | Overall (n=560) | Tribal (n=296) | Non tribal (n=264) | Chi-square | p-value | |||
|---|---|---|---|---|---|---|---|---|---|
| Frequency | Percentage | Frequency | Percentage | Frequency | Percentage | ||||
| Underweig ht | Normal | 482 | 86.1 | 268 | 90.5 | 214 | 81.1 | 11.776 | 0.003 |
| Moderate | 46 | 8.2 | 19 | 6.4 | 27 | 10.2 | |||
| Severe | 32 | 5.7 | 9 | 3.0 | 23 | 8.7 | |||
| Stunting | Normal | 406 | 72.5 | 227 | 76.7 | 179 | 67.8 | 11.627 | 0.003 |
| Moderate | 88 | 15.7 | 47 | 15.9 | 41 | 15.5 | |||
| Severe | 66 | 11.8 | 22 | 7.4 | 44 | 16.7 | |||
| Wasting | Normal | 524 | 93.6 | 284 | 95.9 | 240 | 90.9 | 5.939 | 0.051 |
| Moderate | 23 | 4.1 | 8 | 2.7 | 15 | 5.7 | |||
| Severe | 13 | 2.3 | 4 | 1.4 | 9 | 3.4 | |||
| MUAC level in cm | 11-12.5 | 32 | 5.7 | 19 | 6.4 | 13 | 4.9 | 0.579 | 0.447 |
| Above 12.5 | 528 | 94.3 | 277 | 93.6 | 251 | 95.1 | |||
A total of 37 service providers i.e., AWW were assessed, 22 serving in tribal area and 15 service in non-tribal area. Though majority (94.6%) know that exclusive breast feeding should be given up to 6 months which is known to 54.5% AWW serving in tribal area while in AWWs working in non-tribal area it was known to all. Appropriate age of initiation of complimentary feeding was as 6 months was known to almost all (90.9% for tribal vs 100% for non-tribal). Importance of formula feeding was still perceived by 24.3% (31.8% in tribal vs 13.3% in non-tribal, p=0.198) population. Importance of components of complimentary feeding practices was again variable in both the group though statistically significant difference does not exist. Overall, 70 % know about quantity, 81.1% know about quality, 64.9% know about frequency, 59.5% know about diversity while only 43.2% know about consistency which is again lower amongst AWWs working in non-tribal area (54.5% vs 26.7%, p=0.093). [Table 4]
| Variable | Comment | Overall (n=37) | Tribal (n=22) | Non tribal (n=15) | Chi-square | p-value | |||
|---|---|---|---|---|---|---|---|---|---|
| Frequency | Percentage | Frequency | Percentage | Frequency | Percentage | ||||
| Age of exclusive breast feed | <6 months | 1 | 2.7 | 1 | 4.5 | 0 | 0 | 1.442 | 0.486 |
| = 6months | 35 | 94.6 | 12 | 54.5 | 15 | 100 | |||
| >6 months | 1 | 2.7 | 9 | 40.9 | 0 | 0 | |||
| Appropriate age of initiation of CF | <6 months | 1 | 2.7 | 1 | 4.5 | 0 | 0 | 0.753 | 0.686 |
| = 6months | 35 | 94.6 | 20 | 90.9 | 15 | 100 | |||
| >6 months | 1 | 2.7 | 1 | 4.5 | 0 | 0 | |||
| Importance of formula food for a child | Yes | 9 | 24.3 | 7 | 31.8 | 2 | 13.3 | 1.656 | 0.198 |
| No | 28 | 75.7 | 15 | 68.2 | 13 | 86.7 | |||
| Important componen ts of the appropriat e CF practices | Quantity | 26 | 70.3 | 14 | 63.6 | 12 | 80.0 | 1.143 | 0.28 5 |
| Quality | 30 | 81.1 | 16 | 72.7 | 14 | 93.3 | 2.469 | 0.11 6 | |
| Frequenc y | 24 | 64.9 | 14 | 63.6 | 10 | 66.7 | 0.036 | 0.85 | |
| Diversity | 22 | 59.5 | 13 | 59.1 | 9 | 60.0 | 0.003 | 0.95 6 | |
| Consisten cy | 16 | 43.2 | 12 | 54.5 | 4 | 26.7 | 2.824 | 0.09 3 | |
Kitchen garden was present in 52.9% of the studied households, which is significantly high in tribal compared to non-tribal population (64.9% vs 39.4%, p=0.000). But the type of kitchen is seasonal in most of the cases (92.9%; 93.2% vs 92.3%). Majority uses kitchen garden produce for their own consumption (85.8%; 87% vs 83.7%), but only 45.9% (46.9% amongst tribal vs 44.2% non-tribal) used their kitchen garden produce for preparation of complimentary food. Fish pond was found in 24.1% household (23% in tribal vs 25.4% in non-tribal), while 29.6% (45.6% tribal vs 13.4% non-tribal) use fish from their own pond for feeding child as complimentary feeding. Majority produce fish 87.4% (89.7% tribal vs 85.1% non-tribal) for their own consumption. [Table 5]
| Variable | Comment | Overall (n=560) | Tribal (n=296) | Non tribal(n=264) | Chi-square | p-value | |||
|---|---|---|---|---|---|---|---|---|---|
| Frequency | Percentage | Frequency | percenta _ge | Frequency | Percentage | ||||
| Kitchen garden | Yes | 296 | 52.9 | 192 | 64.9 | 104 | 39.4 | 36.331 | 0.000 |
| No | 264 | 47.1 | 104 | 35.1 | 160 | 60.6 | |||
| Type of kitchen garden (n=296) | Seasonal | 275 | 92.9 | 179 | 93.2 | 96 | 92.3 | 0.087 | 0.768 |
| Throughout the year | 21 | 7.1 | 13 | 6.8 | 8 | 7.7 | |||
| Purpose of kitchen garden (n=296) | Own consumption | 254 | 85.8 | 167 | 87.0 | 87 | 83.7 | 0.613 | 0.434 |
| Selling | 0 | 0 | 0 | 0.0 | 0 | 0.0 | |||
| Both | 42 | 14.2 | 25 | 13.0 | 17 | 16.3 | |||
| Production of kitchen garden used as CF (n=296) | Yes | 136 | 45.9 | 90 | 46.9 | 46 | 44.2 | 0.19 | 0.603 |
| No | 160 | 54.1 | 102 | 53.1 | 58 | 55.8 | |||
| Fish pond | Yes | 135 | 24.1 | 68 | 23.0 | 67 | 25.4 | 0.506 | 0.506 |
| No | 425 | 75.9 | 228 | 77.0 | 197 | 74.6 | |||
| Product of fish pond used as CF (135) | Yes | 40 | 29.6 | 31 | 45.6 | 9 | 13.4 | 16.736 | 0.000 |
| No | 95 | 70.4 | 37 | 54.4 | 58 | 86.6 | |||
| Production of fish used for(n=135) | Own consumption | 118 | 87.4 | 61 | 89.7 | 57 | 85.1 | 0.658 | 0.417 |
| Selling | 0 | 0 | 0 | 0.0 | 0 | 0.0 | |||
| Both | 17 | 12.6 | 7 | 10.3 | 10 | 14.9 | |||
| Live stock available | Yes | 452 | 80.7 | 253 | 85.5 | 199 | 75.4 | 9.134 | 0.003 |
| No | 108 | 19.3 | 43 | 14.5 | 65 | 24.6 | |||
| Live stock (n=452) | Hen | 239 | 52.9 | 159 | 62.8 | 80 | 40.2 | 22.92 3 | 0.00 0 |
| Duck | 205 | 45.4 | 118 | 46.6 | 87 | 43.7 | 0.384 | 0.53 6 | |
| Goat | 150 | 33.2 | 99 | 39.1 | 51 | 25.6 | 9.159 | 0.00 2 | |
| Cow | 330 | 73 | 189 | 74.7 | 141 | 70.9 | 0.838 | 0.36 0 | |
| Buffalo | 13 | 2.9 | 3 | 1.2 | 10 | 5.0 | 5.878 | 0.01 5 | |
| Pig | 180 | 39.8 | 143 | 56.5 | 37 | 18.6 | 66.86 6 | 0.00 0 | |
| Others | 15 | 3.3 | 10 | 4.0 | 5 | 2.5 | 0.72 | 0.39 6 | |
| Live stock used for (n=452) | Own consumption | 165 | 36.5 | 67 | 26.5 | 98 | 49.2 | 32.855 | 0.000 |
| Selling | 20 | 4.4 | 19 | 7.5 | 1 | 0.5 | |||
| Both | 267 | 59.1 | 167 | 66.0 | 100 | 50.3 | |||
| Live stock used for CF (n=452) | Yes | 152 | 33.6 | 98 | 38.7 | 54 | 27.1 | 6.715 | 0.010 |
| No | 300 | 66.4 | 155 | 61.3 | 145 | 72.9 | |||
Live stock was present in 80.7% households (85.5% tribal vs 75.4% non-tribal, p=0.003), which is significantly higher amongst tribal. Hen/chicken was the commonest live stock (52.9%; 52.8% in tribal vs 40.2%, p=0.000), followed by duck (45.4%; 46.6% tribal vs 43.7% non-tribal, p=0.536), Cow for milk production in 73% (74.7% tribal vs 70.7% non-tribal, p=0.36) and pig (pork) 39.8% (56.5% tribal vs 18.6%, p=0.000), which is significantly higher tribal population. Of the live-stock present 36.5% uses for their own consumption (26.5% tribal vs 49.2% non-tribal; p=0.000), which is significantly higher amongst non-tribal population. Only 33.6% of livestock produced were used for preparation of complimentary feeding (33.6%; 61.3% tribal vs 72.9%; p=0.01), which significantly higher amongst non-tribal population. [Table 5]
DISCUSSION
WHO recommended infant and young child feeding practices in term of IYCF 8 core indicators and 6 optional indicators along with their socio-demographic, maternal, child and other characteristics. The present study revealed that early initiation of breastfeeding within 1 hour of birth was 79.3% which is better than the national (41.8%) and Assam (49.2%) average reported in NFHS 5(2019-21).[10] Among the study population, timely introduction of solid and semi solid food was seen in 36.9% at 6 months children, early introduction was 2.5% at less than 6 months of age and delayed introduction was 60.6%. As per the WHO cut-off for rating, the present percentage stood within the range 60-79% denoted as ‘Fair’ practice in the community. Children of 6 to 8 months who received both solid and semi solid food along with breastmilk was 75% which was higher than the state report -51.7% (rural-51.2%, urban-57.6%) as well as national report-45.9% (rural 43.9%, urban-52.0%) of NFHS-5. [10] The energy needs from complementary foods also differs between infants who are breastfed and non-breastfed; for which guidelines for complementary feeding were made separately pertaining to their needs. However in both, responsive feeding and safe preparation of these complementary foods were vital components of the guideline.[2] WHO has recommended continued breastfeeding up to 2 years or beyond along with age appropriate introduction of hygienic complementary food as complimentary breastfeeding. [7] It ensures at least the benefits of breast milk irrespective of families’ ability to provide diverse range of complementary food especially among those living with limited access to safe water and Children of 12-23 months of age can still receive 35-40% of their total energy needs form breast milk. Breast milk continues to be a key source of energy and essential fatty acids because of its relatively high fat content compared to most complementary foods. Its fat content was assumed to be critical for utilization of pro-vitamin A carotenoids in predominantly plant-based diets such as in India with an evident vegetarian population. [2]
It was observed that about 37.74% of children 6 to 12 months received minimum dietary diversity which is comparatively higher than findings reported for urban informal settlement of Mumbai by Bentley et al. [11] Istiyaq Ahmad, in their cross-sectional survey conducted in Aligarh in 2017 reported 42.6% (95% CI = 37.4%-48.1%) of children receiving minimum dietary diversity. [12] The children receiving minimum acceptable diet in this study was about 24.7%. This finding is contrary to the NFHS-5 (2019-2021) reports, where minimum acceptable diet is higher among non-breastfed children (12.7%) compared to breastfed (11.1%) [10]
Lack of knowledge among the mothers and primary care givers about the minimum number of meals and types of food groups requirement at that age was evident in our study. It also reveals lack of counselling on all aspects of complementary feeding to the community. The study reveals that most of the mothers received counselling on exclusive breastfeeding but very few had knowledge about the complementary feeding as well as early initiation of breastfeeding.
Consumption of iron-rich or iron fortified foods, i.e. number of children consuming flesh foods and green leafy vegetables was low 25.6% and 45.7% among the children though availability of kitchen garden is encouraging in number but majority were seasonal and utilization of kitchen garden produce for preparation of complimentary food was less. The NFHS-4 report for country's average consumption of flesh foods among the same age-group was also 24%. The similar study conducted by Aguayo, et al in Maharashtra reported lower percentage of 12.1% for IYCF i.e., indicator 8. [13]. The study revealed that children ever breastfed was almost universal (99.30%), During the survey only 58% of 6-12 months children continued to receive breast milk.
Knowledge level of AWWs was found to be poor amongst the studied service providers.
Capacity building of the AWWs at the community level with necessary knowledge and skills to promote the recommended IYCF guidelines would improve the IYCF practices at the community level. Mothers/ caregivers attending facilities like Anganwadi centre (AWC) need to be educated/ counselled on different issues related to breast feeding and complementary feeding. Village health and nutrition day (VHND) celebration at AWCs may be utilized as a plate form for imparting knowledge related to complimentary feeding for the community. The scope of behaviour change communication (BCC) in nutrition has expanded rapidly in recent years, fuelled by the growing recognition that social and behavioural change interventions are fundamental to achieving the nutrition-related goals. Behaviour change communication (BCC) is a key component of infant and young child feeding (IYCF) programmes in low-resource countries. [14]
CONCLUSION
Health education and demonstration of recommended complementary diet with locally available homemade ingredient with knowledge while disseminating knowledge that home-made foods are no inferior to artificial feeding may enhance mothers’ self-confidence and independence concerning infant feeding.
The findings show that the main barriers to the use of appropriate infant and young child-feeding practices fall under four themes: caregiver's knowledge about breastfeeding, caregiver's knowledge about complimentary feeding, influence of culture custodians on the caregivers, and patterns and burden of other responsibilities the caregivers have in the household.[15] The information regarding complimentary feeding practices was collected by interviewing the mothers/ primary care givers of the under 2 children -quality of such information might have been influenced by recall bias. Appropriately designed in-depth research studies should be undertaken to understand the social and behavioural determinants and other aspects of improper IYCF practices.
AUTHORS CONTRIBUTION
TGM: Concept, Design, Manuscript editing. PR: Manuscript editing. MB: Study implementation. SB: Data Analysis
Source of Funding:
UNICEF
Conflict of Interest:
The authors declare no conflict of interest.
REFERENCES
- The first 1,000 days of life: The brain's window of opportunity. [online] :. Available at: <https://www. unicef-irc.org/article/958-the-first-1000-days-of-life-the-brains-window-of opportunity.html> (accessed )
- [Google Scholar]
- Guiding principles for complementary feeding of the breastfed child [Internet] WHO. [online] Available at: <Available from: https://www.who.int/nutrition/publications/infantfeeding/a85622/en/.> (accessed )
- [Google Scholar]
- Planning Guide for national implementation of the Global Strategy for Infant and Young Child Feeding. Available from: http://apps.who.int/iris/bitstream/handle/10665/43619/ 9789241595193_eng.pdf?ua=1> (accessed )
- [Google Scholar]
- Factors associated with mothers' knowledge on infant and young child feeding recommendation in slum areas of Bahir Dar City, Ethiopia: cross sectional study. BMC Res Notes. 2017;5(10):191. 1
- [CrossRef] [PubMed] [Google Scholar]
- Impact of breast milk on IQ, brain size and white matter development. 2010. [online] Pediatr Res. 67:357-62. Available from: https://www.ncbi.nlm.nih.gov/pmc/articles/PMC29392 72/> (accessed )
- [CrossRef] [PubMed] [Google Scholar]
- Global strategy for infant and young child feeding. WHO. Available from: http://www.who.int/nutrition/publications/infantfeeding/9241562218/en/> (accessed )
- [Google Scholar]
- UNICEF and the Global Strategy on Infant and Young Child Feeding (GSIYCF) Understanding the Past -Planning the Future, Final Report on Distribution.pdf [Internet] Available from: https://www.unicef.org/nutrition /files /FinalReportonDistribution.pdf (accessed )
- [Google Scholar]
- From the First Hour of Life: A new report on infant and young child feeding. 2016. UNICEF DATA. [online] Available from: https:// data.unicef.org / resources / first-hour-life-new-report-breastfeeding-practices.> (accessed )
- [Google Scholar]
- Indicators for assessing infant and young child feeding practices Part 2 Measurement eng.pdf. Available from: https://www.who.int/nutrition /publications/infantfeeding/9789241599290/en/> (accessed )
- [Google Scholar]
- Malnutrition and infant and young child feeding in informal settlements in Mumbai, India: findings from a census. Food Sci Nutr. 2015;3(3):257-71.
- [CrossRef] [PubMed] [Google Scholar]
- Systematic review of infant and young child complementary feeding practices in South Asian families: the India perspective. Public Health Nutr. 2018;21(4):637-54.
- [CrossRef] [PubMed] [Google Scholar]
- Determinants of stunting and poor linear growth in children under 2 years of age in India: an in-depth analysis of Maharashtra's comprehensive nutrition survey. Matern Child Nutr 2016 12(Suppl 1):121-40.
- [CrossRef] [PubMed] [Google Scholar]
- Pelto, Stephanie L. Martin, Marti Van Liere and Cecilia S. Fabrizio. The scope and practice of behaviour change communication to improve infant and young child feeding in low-and middle-income countries: results of a practitioner study in international development organizations. 2015 John Wiley & Sons Ltd Maternal and Child Nutrition 2015
- [Google Scholar]
- Muliira. Barriers to Infant and Child-feeding Practices: A Qualitative Study of Primary Caregivers in Rural Uganda. J Health Popul Nutr. 2015;33(1):106-116.
- [Google Scholar]