Translate this page into:
Care Seeking Practices for Chronic Pain and its correlates among Adults: an experience from a Rural Block of West Bengal
Corresponding author: Dr. Niladri Banerjee, Indrakanan, Sripalli, Burdwan, West Bengal, PIN: 713103, Email: nibknock@gmail.com
-
Received: ,
Accepted: ,
Abstract
Background:
Chronic pain, though a most common cause of disability worldwide, is one of the most underestimated health problems throughout the world. With the ageing population and its increasing prevalence, understanding related care seeking practices is key to plan effective interventions.
Objectives:
To find out the characteristics of chronic pain and to study related and care-seeking practices and the influence of socio-demographic factors among adult chronic pain sufferers in a rural setting.
Methods:
Data were collected from 697 adults (>18 years) chronic pain (>12 weeks duration) sufferers chosen randomly from all 81 villages of Amdanga block, West Bengal, through a household-based survey in a cross-sectional design. A pre-designed, pre-tested structured questionnaire containing socio-demographic information, Brief Pain Inventory (BPI) and Patient Health Questionnaire-9 (PHQ-9) was used. During analysis, dimension reduction by Principal Component Analysis was done to derive pain intensity and interference scores.
Results:
Low back pain and knee pain were first and second most frequent. Major Depressive Syndrome (MDS) was found in 9.04 % [95% CI: 7.95% -10.13%]. The severity of pain increased with age and decreased with advancing level of education & income. Care-seeking was significantly predicted by MDS (AOR= 0.185), pain intensity (AOR=1.06) & interference (AOR=1.06).
Conclusion:
Patients tend to seek care more at an advanced severity and more from a private facility. About 1 in 10 persons with chronic pain was seen to suffer from major depression, with which, persons were seen about five times less likely to seek care.
Keywords
Chronic pain
Care-seeking
Major Depressive Syndrome
Rural
West Bengal

Introduction:
Chronic pain is a common condition which causes significant suffering and disability among the adult population. Still, it remains one of the most underestimated health problems throughout the world.[1] Though the duration of pain to be considered as chronic varied across scientific literature, most frequently operationalized minimum duration is 3 months as recognized by WHO and International Association for the Study of Pain (IASP) in ICD 11.[2] It interferes with the quality of life including its social and family aspects as well as with the ability to work.[3] The prevalence of non-specific chronic pain in the general population worldwide is reported to be as high as 50%.[4,5] Region wise, about 1 in 5 adults in Europe [6] and Australia[7] and about 31% of adults in the USA[8] suffer from chronic pain. According to The Vanderbilt Global Pain Survey report, the prevalence of chronic pain in India ranges between 24% to 41%[9] One study suggests that less than one- third patients suffering from chronic joint pain sought care from Government institutions.[10] It is imperative to find out the care seeking practices and its determinants among the general population, as well as to compare outcomes across various practices, for addressing the chronic pain epidemic with optimal resource utilization. Care-seeking practice gives an idea of what people do when they suffer from chronic pain, and the factors influencing those practices. The factors may be the characteristics of the subjects, characteristics of the disease or characteristics of health services.[11] In this study, an attempt has been made to find out the characteristics of chronic pain, to study related care-seeking practices and to find out the influence of socio-demographic factors on them, among adult chronic pain sufferers in a rural setting.
METHODOLOGY:
It was an observational descriptive study with cross-sectional design done at Amdanga Community Development Block (the rural field practice area of Department of Community Medicine, R. G. Kar Medical College), North 24 Parganas, West Bengal among adults with pain that persists or recurs for more than 12 weeks and residing in the block for at least 6 months. Individuals, unwilling to give consent for the study or too sick to respond, were excluded from the study. Data were collected during December 2016 and January 2017.
Considering a 95% level of confidence (Zα = 1.96) and an absolute precision of 3.5% with an estimated prevalence as 30.6% (prevalence of Indian rural adults seeking treatment from Govt. healthcare facilities for chronic back and/or joint pain)[10], the required sample size was 666 individuals. For a better representation, all the villages (n=81) were decided to be included. Number of individuals to be selected from each village were decided by the formula [(sample size/total population of the block) *population of the village] as there was significant variation in villages populations; but, rounding off for whole numbers in case of persons to be selected from each village increased the sample size by about 5% giving the final size of 697.
Individuals were selected by going to a central point of a village & finding out a direction to start survey by lottery. In the selected direction, consecutive houses were approached and one person from one household, if found appropriate and provided consent, was interviewed until the required number from that village was met.
Study tool:
A pre-designed, pre-tested, structured schedule was used containing three sections.
Questions regarding socio-demographic characteristics of participants and their care seeking practices for chronic pain.
Brief Pain Inventory Questionnaire(BPI)- for rapid assessment of severity of pain and its impact on functioning, developed by Cleeland and colleagues[12]. BPI has been previously validated in Indian context[13]. Sites affected by pain were shaded in a human diagram and other items were recorded in a 10-point rating scale where 0 represented least and 10 highest.
Patient Health Questionnaire-9 (PHQ-9)- an inventory used as screening tool for depression. It is part of PHQ which is the self-administered version of the PRIME-MD developed by Robert. L. Spitzer et al.[14]
The schedule was translated into Bengali and again retranslated and checked for consistency. A group of experts of Community Medicine gave their inputs on these questions and ascertaining face validity. The conceptual, cultural and semantic equivalences were well judged as these questions may mean differently in different context. Cronbach's alpha was done to ascertain the convergent validity.
Ethical approval:
The study was approved by the Institutional Ethics Committee of R.G. Kar Medical College & Hospital. The procedures followed were in accordance with the Helsinki Declaration of 1975, as revised in 2000.
Statistical Analysis:
Data were assembled in Microsoft Excel 2010 software. Categorical data were described in terms of absolute numbers and proportions. Continuous data were checked for normality and were represented by median & interquartile range(IQR) or mean & standard deviation(SD). Chi-square test was done for seeing an association in contingency tables. Mann Whitney U test was done for continuous data spread over two categories. Age was divided roughly into quartiles to reduce misclassification bias. Studies using Confirmatory Factor Analysis to Evaluate Construct Validity of the Brief Pain Inventory suggested a better fit for a two-factor model than one-factor model[15,16]. So, Principal Component Analysis was done for parts of Brief Pain Inventory Questionnaire to derive 1 component for pain intensity (KMO = 0.745, variance explained: 72%) & 1 component for pain interference (KMO = 0.882, variance explained: 68%) (with Eigenvalue 1 as extraction criterion). Multiple linear regression and Binomial logistic regression were used to predict pain severity and care-seeking behaviour respectively.
Results:
488 of the respondents, i.e., 70.0 % were female. The median age of study population was 45 years (IQR = 21 years). Individuals completing primary education were most frequent (42.6%) whereas 200 (28.7%) persons were illiterate. Among females, 92% were homemakers and most (67%) of the males were unskilled workers. The median family income of the studied population was Rs.5000 per month (IQR- Rs.3000). Table 1.
| Number (Percentage) | Pain Intensity | Regression Coefficients (95% CI)a | Interference due to Pain | Regression Coefficients (95% CI)b | ||
|---|---|---|---|---|---|---|
| Mean (SD) | Significancea | Mean (SD) | Significanceb | |||
| SEX | Male | 209 (30.0) | 50.15 (9.79) | -0.55 (-2.10 to 0.10) 0.485 | 50.17 (9.70) | -0.68 (-2.10 to 0.74) 0.348 |
| Female | 488 (70.0) | 49.65 (10.49) | 49.59 (10.67) | |||
| AGE (in years) | < 35 | 189 (27.1) | 46.38 (9.66) | 1.35 (0.69 to 2.01) 0.000 | 45.51 (8.18) | 1.89 (1.27 to 2.49) 0.000 |
| 35 to 45 | 184 (26.4) | 50.93 (10.29) | 50.28 (9.63) | |||
| 46 to 55 | 149 (21.4) | 50.32 (9.13) | 51.16 (10.75) | |||
| > 55 | 175 (25.1) | 52.65 (9.72) | 53.57 (9.78) | |||
| EDUCATION | Illiterate | 200 (28.7) | 53.18 (9.41) | -0.84 (-1.56 to -0.12) 0.022 | 53.67 (9.95) | -1.02 (-1.68 to -0.36) 0.003 |
| Less than primary | 92 (13.2) | 49.77 (10.82) | 50.77 (9.94) | |||
| Completed Primary Education | 297 (42.6) | 48.62 (9.42) | 48.54 (9.52) | |||
| Completed Secondary Education | 108 (15.5) | 48.08 (10.61) | 46.55 (9.37) | |||
| INCOME (Per month, in Rupees) | < 3500 | 218 (31.3) | 51.28 (9.80) | -0.71 (-1.34 to -0.08) 0.027 | 51.74 (10.42) | -0.965 (-1.55 to -0.38) 0.001 |
| 3501 to 5000 | 207 (29.7) | 50.39 (10.51) | 50.77 (9.66) | |||
| 5001 to 6499 | 122 (17.5) | 50.74 (9.64) | 50.10 (9.92) | |||
| > 6500 | 150 (21.5) | 46.99 (9.31) | 46.31 (8.99) | |||
| PRESENCE OF DEPRESSION | Not Depressed | 583 (83.6) | 48.68 (9.48) | 7.32 (5.43 to 9.21) 0.000 | 48.11 (8.90) | 10.56 (8.83 to 12.29) 0.000 |
| Depressed | 114 (16.4) | 56.75 (9.89) | 59.66 9.74) |
a. Multiple regression analysis; F (5, 691) = 23.02, p <0.000; R2 = 0.143
b. Multiple regression analysis; F(5, 691) = 53.15, p<0.000; R2 = 0.278
In 98% cases, the chronic pain was of musculoskeletal in origin. The most frequently affected site was Lower Back (57.7%) followed by Knees (54.8 %). Figure 1. Occupation wise, skilled workers had more headache and shoulder pain, clerical workers and businessmen had more neck pain and homemakers had more ankle pain. About 1% respondents were suffering from abdominal pain and 1% from chest pain. On Patient Health Questionnaire, the prevalence of MDS is found to be 9.04 percent [95% CI: 7.95% to 10.13%]. Pain intensity and interference due to pain were seen to increase with age and presence of depression while they decreased with advancing education and monthly income. Multiple regression was run to predict pain intensity and interference from age, sex, education, income and presence of depression. The models statistically significantly predicted the scores, F (5, 691) = 23.02, p < .0005, R[2] = .14 for Pain intensity and F (5, 691) = 53.15, p < .0005, R[2] = .28 for Pain interference. All variables except sex added significantly to the prediction, p < .05. Regression coefficients can be found in Table 1.
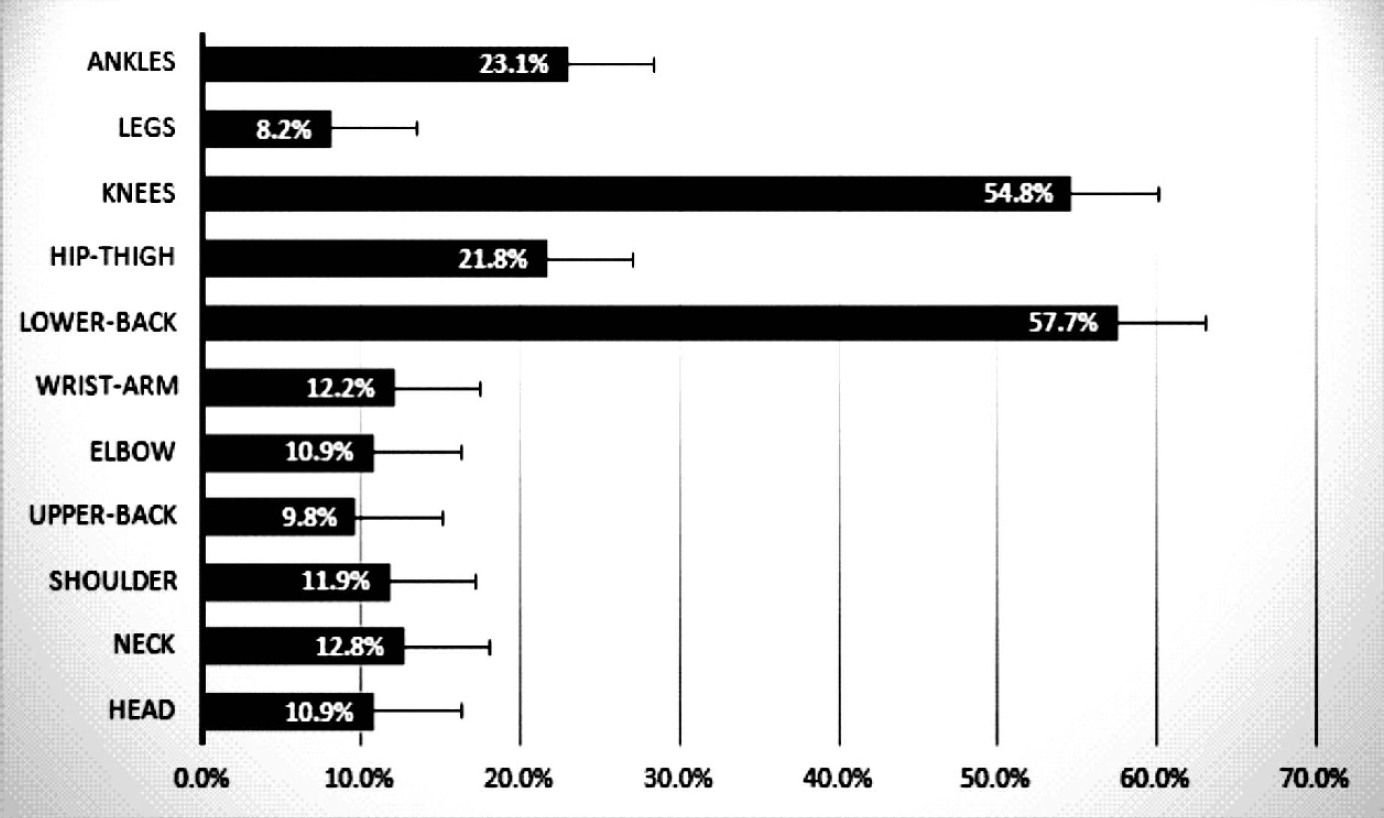
- Simple Bar diagram showing site-wise frequency of pain (n = 697)
249 (35.7 %) respondents were not on any treatment for their pain. Among the rest (64.3%), the majority (63.4%) went to private facilities and took allopathic medications. Significant difference in pain relief was found between Allopathy (median pain relief=70) & AYUSH (median pain relief=60) [p=0.000] but not between Govt. and Private facilities as can be seen in Table 2. The proportion of sufferers seeking any care, increased with advancing intensity and interference scores, as can be seen in Figure 2, however on binary regression model persons with MDS were found 5.41 (95% CI: 2.71-10.81) times less likely to seek care than persons without MDS when adjusted for pain intensity and interference. Table 3.
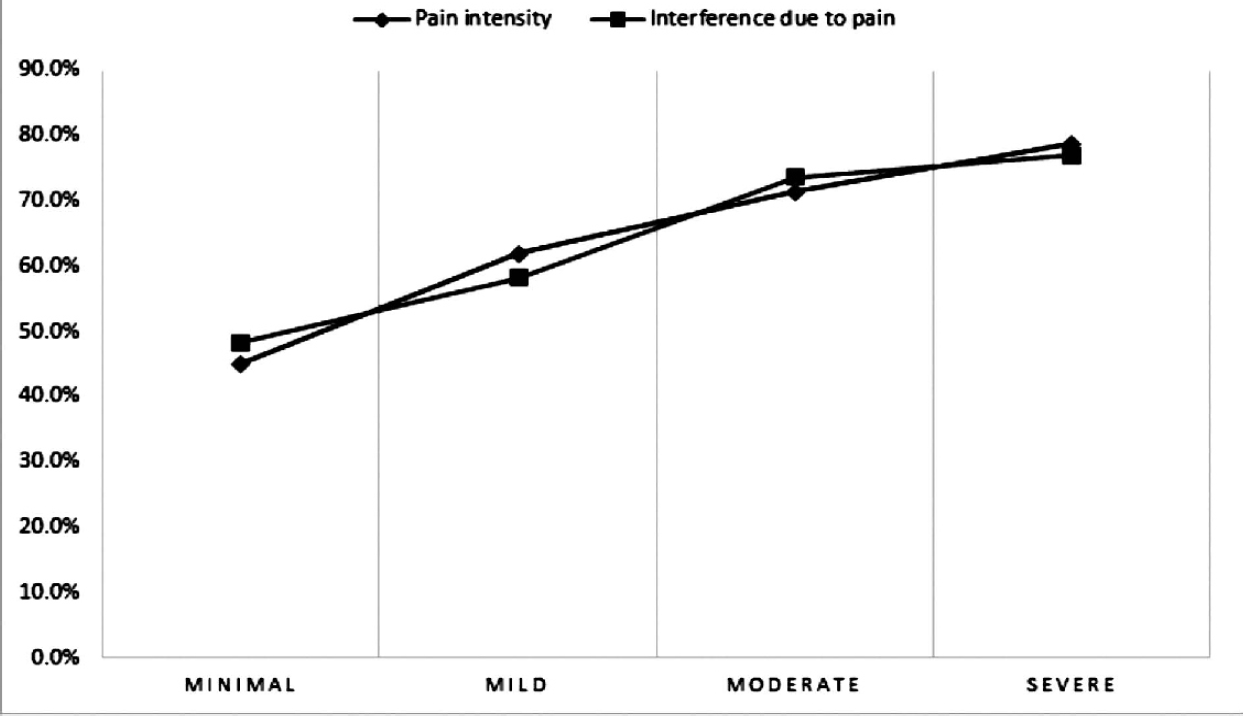
- Line diagram showing percentages of individuals seeking care with increasing severity of pain intensity and interference (n=697)
| Care-Seeking Practices | Number (Percentage) | Median Perceived Pain Relief (IQR) | p value | |
|---|---|---|---|---|
| Source | Govt. | 164 (36.61) | 70(60) | 0.410 |
| Private | 284 (63.39) | 70(50) | ||
| Type | Allopathy | 363 (81.03) | 70(50) | 0.000 |
| Ayush | 85 (18.97) | 60(40) | ||
| Variables | Categories | p-value | OR | 95% CI of OR |
|---|---|---|---|---|
| Pain intensity | - | 0.000 | 1.06 | 1.03-1.08 |
| Interference due to pain | - | 0.000 | 1.06 | 1.03-1.09 |
| Major Depressive Syndrome | Absent | Ref. | ||
| Present | 0.000 | 0.185 | 0.09-0.37 | |
| Age (in years) | < 35 | Ref. | ||
| 35 to 45 | 0.630 | 1.13 | 0.70-1.80 | |
| 46 to 55 | 0.718 | 1.10 | 0.65-1.85 | |
| > 55 | 0.195 | 1.43 | 0.83-2.45 | |
| Sex | Female | Ref. | ||
| Male | 0.161 | 0.76 | 0.51-1.11 | |
| Education | Illiterate | Ref. | ||
| Less than primary | 0.039 | 1.91 | 1.03-3.55 | |
| Competed Primary Education | 0.927 | 0.98 | 0.62-1.55 | |
| Completed Secondary Education | 0.041 | 1.89 | 1.03-3.48 | |
| Income | < 3500 | Ref. | ||
| 3501 to 5000 | 0.166 | 0.73 | 0.47-1.14 | |
| 5001 to 6499 | 0.511 | 1.19 | 0.70-2.02 | |
| > 6500 | 0.612 | 1.14 | 0.69-1.87 |
Model Chi. Sq p value <0.0005, Hosmer & Lemeshow test, p=0.168, NagelkerkeR[2]=0.212, correctly classifies 70.2 %.
Discussion:
Females are overrepresented in our study primarily because at the time of the household-based survey most of the men were in the workplace. That the prevalence of chronic pain is more in females, as suggested in a literature review by Fillingim et al.[17], may also contribute.
The prevalence of advanced stages of cancer, as a source of chronic pain, is way lower than the prevalence of musculoskeletal disorders in the Indian context. In our study, ninety-eight percent of all respondents ascribed musculoskeletal sites to their pain. The Low back pain was found most frequent (57.7%) in concordance with the study by Bihari et. al. done in NCR region, India (a cross-sectional study of 2086 subjects).[18] Pain in ankle/feet was seen to be more common among homemakers. A study among rural homemakers of North India by Mishra et. al.[19] found ankle pain to be most frequent among homemakers and conjectured poor design of footwear as a cause. To our experience, long hours of standing during cooking and absence of footwear may contribute.
Major depressive syndrome, as indicated by PHQ-9, was found in 9.04%. Studies suggesting the prevalence of major depression are summarized below:
The finding in this study is nearer to household-based studies than studies on clinic attendees.
The severity of chronic pain, as represented by Pain intensity and interference scores has associations with age, level of education and monthly family Income. Urwin et al.[20] found a strong association of pain with social deprivation. The study conducted in Southern Iran by Zarei et al.[21] showed significant association of pain with educational level and income. In the studied population, aged persons were seen to have fewer years of schooling, probably attributable to the period effect. Less educated people were more involved in strenuous and laborious jobs which yield less income than skilled or clerical jobs which again require less physical labor. Thus age, by itself and through period effect, and education and income may predict the severity of chronic pain mediated by the amount of physical labor.
| Source | Sample Size | Setting | Patients with depression |
|---|---|---|---|
| Magni et al.33(USA) | 2341 | Population households | 16.4 % |
| Von Kroff et al.34(Seattle) | 1500 | Health maintenance organization enrollees | 5.9 % to 10.7 % |
| Dutta et al.[11] (India) | 476 | Pain clinic attendees | 30.7 % |
Though the majority of chronic pain sufferers sought treatment, approximately one-third of them didn't seek any treatment. The care was mainly sought from private health care facilities (63.4 %), in concordance with the general pattern of medical care in India where care is predominantly sought from the Private facilities.[22] Our study also showed that, as the severity of pain increased, proportion of patients seeking care, especially from Govt. institutions also increased. Similar findings are noted in an American study of delimited pain syndrome by Von Korff et al.[23] While Anderson et al.[24] found significant impact of depression on physician consultation in chronic pain, our study found depression to decrease the chance of health care seeking when adjusted for pain severity. Due to the cross-sectional design, it may be interpreted the other way that depression was less likely in patients who sought care, but studies show higher prevalence of depression in clinic attendees than in general population, so earlier interpretation is more likely given that amotivation and isolation accompany depression.
Conclusion and limitations:
The low back pain was most frequent followed by knee pain. The severity of pain and interference with work increased with age and decreased with increasing level of education and income. 9.04 % were found to have major depressive symptoms. The severity of pain increased while the presence of depression decreased the chance of seeking health care. In face of ageing population, early intervention to reduce the severity of chronic pain and active detection of depressed cases are required to address the burgeoning chronic pain epidemic.
Due to the cross-sectional design, the course of care seeking for chronic pain could not be studied. Precise diagnosis of the respondents could not be made in absence of a clinical setting.
Conflicting Interest :
There is no conflict of interest.
Source(s) of support:
Nil.
References:
- supports global effort to relieve chronic pain [Internet]. Who.int. 2017 Available from: http://www.who.int/ mediacentre/news/releases/2004/pr70/en/ (accessed )
- [Google Scholar]
- A classification of chronic pain for ICD-11. Pain. 2015;156(6):1003.
- [CrossRef] [PubMed] [Google Scholar]
- Chronic pain in Canada —prevalence, treatment, impact and the roleof opioid analgesia. In: Pain Res Manag. Vol 7. 2002. p. :179-84.
- [CrossRef] [PubMed] [Google Scholar]
- Chronic pain in a geographically defined general population: studies ofdifferences in age, gender, social class, andpain localization. Clin J Pain. 1993;9(3):174-82.
- [CrossRef] [PubMed] [Google Scholar]
- The epidemiology of chronic pain in the community. Lancet. 1999;354(9186):1248-52.
- [CrossRef] [PubMed] [Google Scholar]
- Survey of chronic pain in Europe: prevalence, impact on daily life, and treatment. European journal of pain. 2006;10(4):287.
- [CrossRef] [PubMed] [Google Scholar]
- Chronic pain in Australia: a prevalence study. Pain. 2001;89(2):127-34.
- [CrossRef] [PubMed] [Google Scholar]
- The prevalence of chronic pain in United States adults: results of an Internet-based survey. The Journal of Pain. 2010;11(11):1230-9.
- [CrossRef] [PubMed] [Google Scholar]
- Chronic Pain and Associated Factors in India and Nepal: A Pilot Study of the Vanderbilt Global Pain Survey. Anesthesia & Analgesia. 2017;125(5):1616-26.
- [CrossRef] [PubMed] [Google Scholar]
- Healthcare Seeking Behavior for Back and Joint Pain in Rural Gadchiroli, India: A Population-Based Cross-Sectional Study. Indian J Community Med. 2014;39(4):229-234.
- [CrossRef] [PubMed] [Google Scholar]
- Anthropological and socio-medical health care research in developing countries. Soc. Sci. Med. 1983;17(3):147-161.
- [CrossRef] [PubMed] [Google Scholar]
- Pain assessment in cancer. In: Osoba D, ed. Effect of cancer on quality of life. Boca Raton: CRC Press; 1991.
- [Google Scholar]
- Validation of the Brief Pain Inventory for chronic nonmalignant pain. The Journal of Pain. 2004;5(2):133-7.
- [CrossRef] [PubMed] [Google Scholar]
- The PHQ-9: Validity of a brief depression severity measure. Gen Intern Med. 2001;16:606-13.
- [CrossRef] [PubMed] [Google Scholar]
- Using confirmatory factor analysis to evaluate construct validity of the Brief Pain Inventory (BPI) Journal of pain and symptom management. 2011;41(3):558-65.
- [CrossRef] [PubMed] [Google Scholar]
- Utilization of brief pain inventory as an assessment tool for pain in patients with cancer: a focused review. Indian journal of palliative care. 2011;17(2):108.
- [CrossRef] [PubMed] [Google Scholar]
- Sex, gender, and pain: a review of recent clinical and experimental findings. The journal of pain. 2009;10(5):447-85.
- [CrossRef] [PubMed] [Google Scholar]
- Musculoskeletal pain and its associated risk factors in residents of National Capital Region. Indian journal of occupational and environmental medicine. 2011;15(2):59.
- [CrossRef] [PubMed] [Google Scholar]
- Prevalence and risk of musculoskeletal pain in rural homemakers of North India. Medical Journal of Dr. DY Patil Vidyapeeth. 2017;10(2):138.
- [CrossRef] [Google Scholar]
- Estimating the burden of musculoskeletal disorders in the community: the comparative prevalence of symptoms at different anatomical sites, and the relation to social deprivation. Annals of the rheumatic diseases. 1998;57(11):649-55.
- [CrossRef] [PubMed] [Google Scholar]
- Chronic pain and its determinants: a population-based study in Southern Iran. The Korean journal of pain. 2012;25(4):245-53.
- [CrossRef] [PubMed] [Google Scholar]
- International Institute for Population Sciences (IIPS) and Macro International. Vol I. Mumbai: IIPS; 2007. p. :436. India. Chapter 13
- [Google Scholar]
- Chronic pain and use of ambulatory health care. Psychosom Med. 1991;53:61-79.
- [CrossRef] [PubMed] [Google Scholar]
- Impact of chronic pain on health care seeking, self care, and medication. Results from a population-based Swedish study. Journal of Epidemiology & Community Health. 1999;53(8):503-9.
- [CrossRef] [PubMed] [Google Scholar]