Translate this page into:
Assessment and comparison of nutritional status of government and private school children of Muzaffarnagar city
Corresponding author: Sangeeta Jain Sharma, Muzaffarnagar Medical College, Email: kind.sangeeta@gmail.com
-
Received: ,
Accepted: ,
How to cite this article: SharmaSJ, Muzammil K. Singh J.V, Alvi MT, Singh RS, a Siddiqui S . Assessment and comparison of nutritional status of government and private school children of Muzaffarnagar city. J Comprehensive Health 2018;6(1) : 47-51.
Abstract
Background:
Malnutrition leads to poor cognitive performance and physical growth in children and is a major component of school health services. Imbalanced nutrition in adolescence can put them at high risk of chronic diseases particularly if combined with adverse lifestyle.
Objective:
This study was designed to assess and compare the nutritional status of government and private school children of Muzaffarnagar city.
Material and Methods:
School based, comparative Cross-sectional study. One private and one government school was selected using unistage stratified random sampling. A total of 1960 (980 each from private school and government school) school children of class 6-12 were studied for socio-epidemiological details, dietary habits, and physical activity. Information on education status, occupation, monthly income of their parents was also collected. Required anthropometric measurements were taken.
Results:
Of 980 children from private school, 90 (9.18%) were underweight,138 (14.08%) were overweight, and 137 (13.97%) were obese. Majority of children from government school were underweight 215 (21.94%) except for 24 (2.45%) overweight children.
Conclusion:
This study shows the dual nature of nutritional problem, under-nutrition among the lower socioeconomic class of govt. school at one side and worrisome epidemic of obesity among the affluent of private school.
Introduction:
The wealth of a nation depends on its healthy citizens. Early childhood constitutes the foundation of adult productivity and nutrition is a major determinant of the quality or strength of this foundation. Optimal physical and mental development of the child is the key to accelerate overall development of any country.
Malnutrition includes both extremes, under-nutrition on one end and over-nutrition on the other. Malnutrition in childhood leads to variety of diseases in later life. The main aim of the nutritional assessment of a community is to know the magnitude and geographical distribution of malnutrition as a major public health problem and to analyze the ecological factors that are directly or indirectly responsible and to suggest appropriate corrective measures. Keeping this in mind, assessment and comparison of the nutritional status of children of both government and private primary schools of Muzaffarnagar city was carried out.
Objectives :
To assess the nutritional status of government and private school children.
To compare the nutritional status of private and government school children.
To correlate the nutritional status of children with selected socio demographic variable and risk factors.
Material and Methods:
Study design: A school based comparative cross-sectional study. Study setting: Private and government schools of Muzaffarnagar city. Sampling method: Unistage stratified random sampling method was used to select the schools. The list of schools with their strength of students was obtained from DEO of Muzaffarnagar. Schools were divided into two strata, government schools, and private schools. Out of each stratum, one private school, and one government school were selected. Systemic random sampling was used for selection of students from government school. Study unit: Students from class 6th to 12th from the randomly selected schools were included in the study. Inclusion and exclusion criteria: Students with chronic illness and endocrine problems were excluded from the study. Students, whose parents did not provide consent and those who were absent or sick during the period of study were excluded. Sample size: The total number of students of private school from class 6th to 12th fulfilling the inclusion criteria was 980. Total strength of the students in government school from class 6th to 12th was about 5000, we took every fifth student till we complete the sample comparable to private school i.e. 980 making a total sample size of 1960. Approval: A prior written approval to conduct the study was taken from Ethical Committee of the institution and school administration. Parents of each participant were informed about the study protocol and written consent was obtained for their child's participation beforehand. Study tools: A semi-structured questionnaire was used to elicit the desired information regarding socio-epidemiological variables of child such as age, sex, religion, type of diet, frequency of consumption of junk food, physical aerobic exercise and outdoor games, duration of watching TV and time spent in front of the computer. To check the feasibility of the questionnaire, a pilot study was carried out on 200 school children. Students were explained about study and questionnaire was distributed in the classroom. Children were guided and instructed to take the questionnaire home and get it filled by their parents/guardians for parent's educational status, occupation, monthly income, which were collected back the next day. One to one interview with children was conducted to verify the informations and height and weight of the children was measured using standardized techniques by using stadiometer and portable dial weighing machine. BMI was calculated using the formula: BMI = Weight(kg) / Height[2] (meter). According to Center for Disease Control and Prevention, BMI for age percentile chart, which is considered to provide an appropriate reference curves for the world population aged 2-20 years. Children were categorized into four groups according to CDC growth chart: ≥ 95th percentile as obese, >85th percentile as overweight, 5-85th percentile as normal and <5th percentile as underweight. Socio-economic status of study subjects was decided according to modified B.G. Prasad classification. All India consumer price index for the month of the September 2016 was taken to update the income. Study duration: 6 months (1st May 2016 – 30th October 2016). Statistical analysis: Data was compiled using Excel software and analyzed using Epi-Info software. Proportion and Chi-square tests with Yates correction have been used in this study. For statistical tests applied, p < 0.05 was considered as the significant level.
| Bio-social character | Private school (N=980) | Government school (N=980) | ||
|---|---|---|---|---|
| Number | Percentage | Number | Percentage | |
| Age (Years) | ||||
| 8-12 | 505 | 51.53 | 222 | 22.65 |
| 12-16 | 370 | 37.75 | 441 | 45.00 |
| 16 and above | 105 | 10.72 | 317 | 32.35 |
| Sex | ||||
| Male | 550 | 56.13 | 638 | 65.11 |
| Female | 430 | 43.87 | 342 | 34.89 |
| Religion | ||||
| Hindu | 830 | 84.69 | 682 | 69.59 |
| Muslims | 115 | 11.73 | 292 | 29.79 |
| Sikh | 20 | 2.04 | 4 | 0.41 |
| Other | 15 | 1.5 3 | 2 | 0.20 |
| Socio-economic status | ||||
| I | 754 | 76.94 | 400 | 40.84 |
| II | 226 | 23.06 | 225 | 22.95 |
| III | 0 | 0 | 200 | 20.40 |
| IV | 0 | 0 | 130 | 13.26 |
| V | 0 | 0 | 25 | 2.55 |
| Education status of mother | ||||
| Illite rate | 0 | 0 | 150 | 15.30 |
| Lite rate | 980 | 100 | 730 | 84.70 |
| Education status of father | ||||
| Illite rate | 0 | 0 | 129 | 13.16 |
| Lite rate | 980 | 100 | 851 | 86.84 |
| Occupation of mothers | ||||
| House wife | 805 | 82.14 | 931 | 95.0 |
| Profess ional | 175 | 17.86 | 49 | 5.00 |
| Occupation of fathers | ||||
| Job/service | 430 | 43.87 | 922 | 94.08 |
| Business | 550 | 56.13 | 58 | 5.9 2 |
| Type of diet | ||||
| Vegetarian | 746 | 76.13 | 540 | 55.11 |
| Non-vegetarian/Mixed | 234 | 23.87 | 440 | 44.89 |
The prevalence of underweight, overweight and obesity among private school children was 90(9.18%), 138(14.08%), and 137(13.97%), respectively. Underweight prevalence was more in government school (21.94%) when compared with private school (9.18%). The overweight prevalence was more in private school (14.08%) than government school (2.45%) This association was statistically significant.
Results:
Among 980 children of private school, maximum percentage (51.53%) was of 8-12 yrs. old, while in government aged 12-16 years were maximum (45%), Sex wise, 43.87% were girls and 56.12% were boys in private school and 34.89% were girls and 65.10% were boys in government school. In both the schools percentage of Hindu children was more. Private school children belonged to only Classes I and II socioeconomic group (none from class iii, iv, and v) while in government school children from class iv and v were also present. All the parents of private school children were literate whereas 15.30% mothers and 13.16% fathers of government school were illiterate.
Students of Classes I and ll socio- economic status of private school showed higher percentage of obesity than Classes 1, ll and lll socio- economic status of government school students (fig 1). Students of all Classes of socio-economic status of government school showed higher percentage of underweight than all Classes of socio-economic status of private school (40 % in call 1 and 72% in class V socio economic status). No underweight children were found in any class of socio-economic status of private school student.
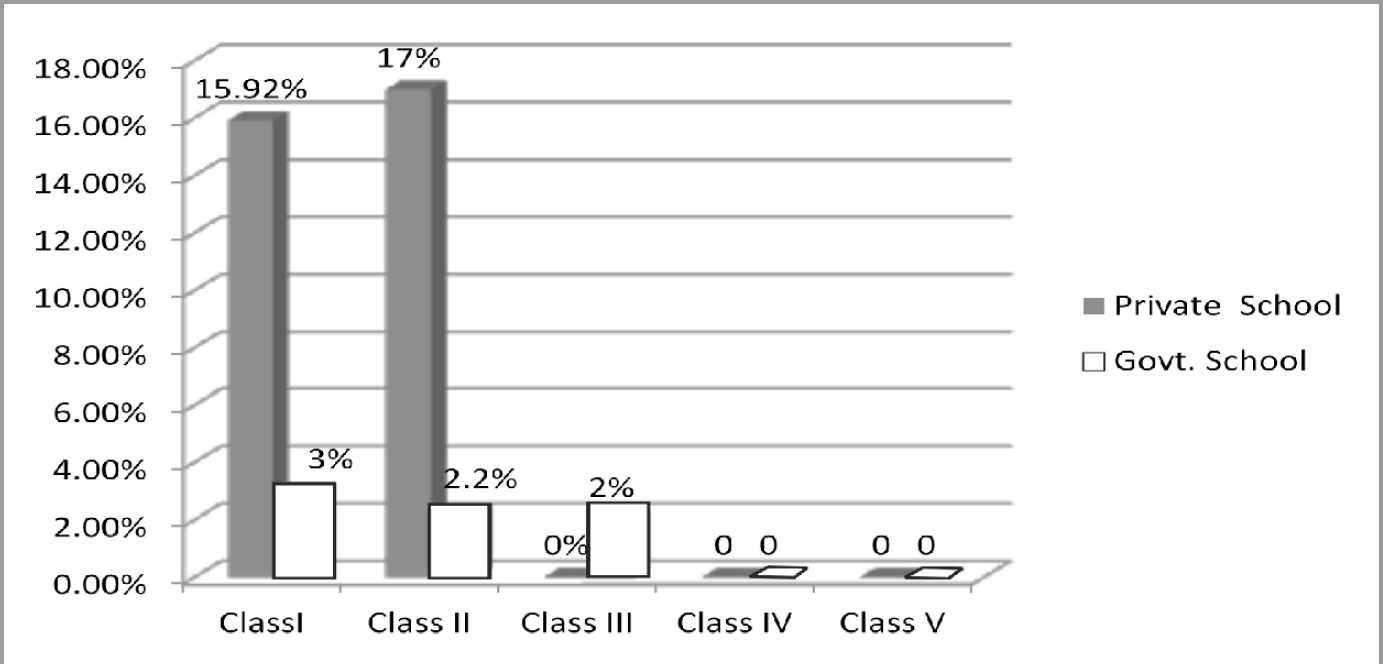
- Obesity among students with different socio economic status in private and government school
| Nutritional status | Private school | Government school | Statistical test | ||
|---|---|---|---|---|---|
| Number | Percentage | Number | Percentage | ||
| Under-weight | 90 | 9.18 | 215 | 21.94 | χ2 =60.6 71 df=1 P<0.0001 |
| Normal | 615 | 62.75 | 721 | 75.37 | χ2=26.417 df=1 P<0.0001 |
| Over weight | 138 | 14.08 | 24 | 2.45 | χ2=87.450 df=l P<0.0001 |
| Obese | 137 | 13.99 | 20 | 2.04 | χ2=94.783 df=l P<0.0001 |
| Total | 980 | 100.0 | 980 | 100.0 | |
Prevalence of obese student was more in male (15.64%) in private school, whereas underweight prevalence was more in females (16.28%) of private school and 33.33% of government school. Association of obesity and sex of the children was significant in private school, while it was insignificant in government school.
| Variable | Private School | Government School | ||||||||
|---|---|---|---|---|---|---|---|---|---|---|
| Sex | UW | Normal | OW | Obese | Total | UW | Normal | OW | Obese | Total |
| Male | 20 (3.64) | 367 (66.73) | 77 (14.00) | 80 (15.64) | 550 (100) | 101 (15.83) | 506 (79.31) | 16 (2.53) | 15 (2.35) | 638 (100) |
| Female | 70 (16.28) | 248 (57.67) | 61 (14.19) | 51 (11.86) | 430 (100) | 114 (33.33) | 215 (62.86) | 8 (2.34) | 5 (1.46) | 342 (100) |
| Total | 90 | 615 | 138 | 137 | 98 | 2515 | 721 | 24 | 20 | 980 |
| χ2 | χ2 = 47.621, df = 3, p = 0.0001 | χ2 = 244.257, df = 3, p = 0.0001 | ||||||||
Figures in parenthesesndicate percentages.
Prevalence of obesity was 19.66% in the private school students who were taking junk food twice or more/week as against 8.68 % in those who were taking junk food just once/week and association was statistically significant(χ2 = 31.828, df = 3, p =0.0001). Same statistically significant association with junk food and obesity was seen in government school students (χ2 = 185.919, df = 3, p =0.0001).
Prevalence of obesity was 18.24% in the private school students who were playing out door games for <1hour as against 8.31 % those who were playing for >1 hour and relation was statistically significant (χ2 = 139.667, df = 3, p = 0.0001). Same statistically significant relation without door games was seen in government school students (χ2 = 71.346, df =3, p= 0.0001).
Discussion:
The key findings of this study included the following, firstly, there was high proportion of underweight, stunting and thinness among pupils attending government school. On the contrary, there was high proportion of overweight among children attending private schools. Prevalence of overweight and obesity seen in this study was same to the findings in study done by Chhatwal et al.,[1] in Punjab (14%). Prevalence of overweight and obesity was higher in our study as compared to the findings in studies by Saraswathi et al.,[2] Mysore (8.75%) and by Kumari and Krishna,[3] in Guntur (8.4%). Sharma et al.,[4] in Delhi have reported higher prevalence of obesityof 22%. The prevalence of under nutrition in government schools of Bangalore as reported by Hasan et al.,[5] was 58.2%, which was more than our study. A recent study conducted by Patnaik et al. in Bhubaneswar,[6] the prevalence of overweight was 27.8% in both Government Schools and Private Schools taken together (private schools- 45.2% and Govt. schools- 10.5%). Compared to it our figure of overweight is very low. Study conducted by Rashmi et al. in govt. school Bangalore[7] showed under nutrition in 61% which is greater than our figure.
The children of private schools who belonged to high socioeconomic class were better nourished compared to Government school students who belonged to low socioeconomic class. Studies by Ramesh,[8] in Kerala and Thekdi[9] in Gujarat also stated the same. A study conducted by Rebecca[10] on Aurangabad school children also mentioned combined prevalence of overweight and obesity in boys and girls as 15.7% and 14.2% respectively. Similar findings were observed by Jigna Shah and Jhanvi et al.[11,12]
Snacks and junk foods consumed at home and outside home is one of the main risk factor for overweight and obesity. This positive association of high calorie/fat rich foods with body weight has been proved by various research studies.[13,14,10,11]
Lack of outdoor game activity and inadequate aerobic exercise were significantly associated with obese private school children. Similar finding was reported by Kotian et al., [15] in Mangalore, which showed higher risk among those participating <2 hour/day in any type of physical activity, whereas higher level of physical activity with poor nutrition led most of the government school children toward undernourishment.
Study by Dietz et al.,[16] have found a positive association between the time spent on watching television/playing computers (≥ 3 hour/day) and increased prevalence of overweight in children, similar to this study.
Conclusion and recommendations::
On the whole, the study revealed that under nutrition is much common among children in government schools but over nutrition appeared to be more common in private schools, largely driven by improved socio-economic status and urbanization. Our findings also reinforce the most important causes of malnutrition including inadequate food consumption due to poverty. Since malnutrition is the outcome of several factors, the problem can be solved only by taking actions simultaneously at various levels - family, school, community, national and international levels through health education, personal hygiene education, nutrition education. Moreover, efforts should be made to control the spread of common childhood infections such as malaria, diarrhea and worm infestations.
Acknowledgment :
The authors thank directors, head, and teachers of schools for granting permission to carry out the study, where the study was conducted. We appreciate parents and guardians who consented for their wards to be part of the study and assisted with eliciting information from the younger pupils.
Conflict of Interest:
There were no conflicts of interest.
Source of funding:
Nil
References
- Obesity among pre-adolescent and adolescents of a developing country (India) Asia Pac J Clin Nutr. 2004;13:231.
- [Google Scholar]
- Prevalence of childhood obesity in school children from urban and rural areas, Mysore, Karnataka, India. J Life Sci. 2011;3:5.
- [CrossRef] [Google Scholar]
- Prevalence and risk factors for adolescents (13-17 years): Overweight and obesity. Curr Sci. 2011;100:373.
- [Google Scholar]
- Growth pattern and prevalence of obesity in affluent schoolchildren of Delhi. Public Health Nutr. 2007;10:485.
- [CrossRef] [PubMed] [Google Scholar]
- Prevalence and risk factors for adolescents (13-17 years): Overweight and obesity. Curr Sci. 2011;100:373.
- [Google Scholar]
- Overweight and obesity among adolescents, a comparative study between government and private schools. Ind Pediatr. 2015;52:779-78117.
- [CrossRef] [PubMed] [Google Scholar]
- Prevalence of malnutritionand relationship with scholastic performance among primary and secondary school children in two select private schools in Bangalore rural district (India) Indian J Community Med. 2015;40:97-102.
- [CrossRef] [PubMed] [Google Scholar]
- Prevalence of overweight and obesity among high school students of Thiruvananthapuram City Corporation, Kerala. Am Med J. 2010;3:650.
- [CrossRef] [Google Scholar]
- Assessment of nutritional and health status of the school students of 5 th to 9 th standard (11-15 years age group) of Surendranagar district, Gujarat state, India. Health line. 2011;2:59-61.
- [Google Scholar]
- Child obesity: A report submitted to IGNOU in partial fulfillment of the requirement for the degree of Masters of Science in Dietetics and food service management, New Delhi. 2011
- [Google Scholar]
- Determinants of overweight and obesity among school children in Mehsana district, India. Research in Pharmacy. 2013;3(2):01-07.
- [Google Scholar]
- Prevalence of overweight and obesity in school going children. Pharmanest. 2011;2(4):369-377.
- [Google Scholar]
- Overweight and obesity among school-going children of Lucknow city. J Family Community Med. 2011;18:59.
- [CrossRef] [PubMed] [Google Scholar]
- Determinants of Overweight and Obesity in Affluent Adolescent in Surat City, South Gujarat region, India. Indian J Community Med. 2011;36:296.
- [CrossRef] [PubMed] [Google Scholar]
- Prevalence and determinants of overweight and obesity among adolescent school children of South Karnataka, India. Indian J Community Med [serial online]. 2010;35:176-8. Available from: http://www.iicm.org. in/text.asp?2010/35/1/176/62587 (accessed )
- [CrossRef] [PubMed] [Google Scholar]
- Introduction: the use of body mass index to assess obesity in children. Am J Clin Nutr. 1999;70(1):123s-125s.
- [CrossRef] [PubMed] [Google Scholar]