Translate this page into:
Air Quality during Covid-19 and it’s Health Effects - A Review
*Corresponding author: Jyoti Rani, Centre of Excellence for Energy and Environmental Studies, Deenbandhu Chhotu Ram University of Science and Technology, Sonipat, Haryana, India. jyoti.energy@dcrustm.org
-
Received: ,
Accepted: ,
How to cite this article: Yadav A, Antil R, Yadav A, Rani J. Air Quality during Covid-19 and it’s Health Effects - A Review. J Compr Health. 2024;12:20-6. doi: 10.25259/JCH_9_2023
Abstract
According to the World Resources Institute in 1996, there were an estimated 7.06 billion people on the planet, and by 2030, that number is expected to rise to 10 billion. Industrialization has become essential to meet the requirements of the ever-increasing population. The industrial revolution has resulted in the release of pollutants into the environment. Among all types of pollution, air pollution is among the most significant, as a human usually inhales 6 L of air in a minute. High concentrations of particulate matter (PM) in the air may lead to asthma. PM plays a crucial role in all of this because of its small size; it may enter the circulation and respiratory system and have detrimental effects on health. High concentration of sulfur and nitrogen oxides causes acid rain to disturb biodiversity and lead to corrosion of materials. Troposphere ozone acts as an evil since it influences evaporation rates, cloud formation, precipitation level, and atmospheric circulation in addition to increasing temperature. Thus, air pollutants can cause severe effects on the environment and humans. The quantity of contaminants that are present has an impact on human health and causes several illnesses. In recent years, there has been considerable concern over global warming driven by the release of atmospheric greenhouse gases, mainly carbon dioxide. The burning of fossil fuels is making survival increasingly difficult. Our atmosphere is heavily polluted globally. Almost all countries contribute to the growth in carbon emissions. In addition to its profound effects on society and the economy, the global community is greatly impacted by the COVID-19 pandemic in terms of health and the environment. From March 25 to May 31, 2020, the government of India imposed a total countrywide lockdown (LD), barring vital facilities and materials to limit the spread of the virus. During this time, there was also an influence on the general quality of the air in and around New Delhi, one of the most polluted cities in the world. During the LD, various studies concluded that humans are mainly responsible for air pollution.
Keywords
Air pollution
Environmental pollution
Clean air
COVID-19

INTRODUCTION
The majority of climatic pollutants released by human activity, such as the burning of fuel in automobiles, power plants, and industrial gear, contribute significantly to air pollution. There are other activities that have a bigger impact on human health, such as soil erosion and forest fires.1 Petrol stations, printing shops, dry cleaners, homes, municipal waste incineration, industrial facilities, metallurgical, fertilizer, and chemical industries, refineries, power plants, and petrochemicals are significant contributors to air pollution.2 Automobiles, planes, trains, and cars are examples of mobile sources. Physical catastrophes such as soil erosion, forest fires, dust storms, and agricultural burning are considered natural causes. The consequences of air pollution on the water and soil environments have also been demonstrated earlier. Increasing air pollution can have deleterious effects on human health. The investigation revealed that a number of radioactive elements, including radium and uranium, build up in bones and cause cancer. After entering the body, these radioactive contaminants have a harmful effect on human health. These effects are frequently reliant on dosage, individual susceptibility, and environmental factors; we also discuss general concerns for both types of impacts in this section, in addition to the more prevalent short and long-term health consequences.3
Continuous exposure to pollutants can exacerbate these conditions by causing harm to the reproductive, neurological, and respiratory systems, as well as raising the chance of cancer and, in the worst circumstances, even death. Long-term health impacts from prolonged exposure to the pollutant should also be associated with the previously mentioned criteria. The respiratory system is seriously harmed by dust, benzene, ozone (O3), particulate matter (PMs), and other substances.4 In addition, there is an increased risk if you already have a respiratory condition such as asthma. Individuals have an increased risk of long-term consequences if they have a predisposed sickness status. The trachea may exhibit alterations in voice quality following an acute exposure to pollutants. Time, place, season, and nation all have a significant impact on health.
After the World Health Organization announced on January 5, 2020, the breakout of a novel coronavirus known as SARS-CoV-2, subsequently, on March 12, 2020, it proclaimed a worldwide pandemic, economies all over the world came to a standstill.5
As of December 12, 2020, India had recorded over 9.8 million infections and 140,000 fatalities from COVID-19. The country’s first case was documented on January 30, 2020, in the state of Kerala.6 India implemented lockdown (LD) measures to stop the virus’s spread, the same as other nations. Public transportation (air, rail, and road) and mobility were restricted, whereas government, private, and industrial activities, offices, and retail centers were closed.
During the LD periods, only critical services (medical, banking, everyday goods, media, communications, etc.) continued to run. Air pollution Scientists believed that this abrupt and unplanned lockout was really a godsend in the fight against air pollution. Following LD, Wuhan, China, had an approximately 63% and 35% decrease in the ambient atmosphere’s quantities of PM and nitrogen dioxide (NO2), respectively. The effects on carbon monoxide (CO) and sulfur dioxide (SO2) were minimal starting on January 23, 2020. Similar to Southampton in the United Kingdom, the lockout on March 23, 2020, resulted in a 92% decrease in NO2 emissions as compared to the same time in 2017–19.7 Research from several nations has generally shown that there is less air pollution during shutdown times. These actions significantly affected the ambient atmosphere’s criterion pollutants.8,9 Criterion pollutants include PM2.5, PM10, carbon dioxide, SO2, and NO2 are among the other pollutants that are categorized.10
EFFECT OF LD ON AIR POLLUTION AT NATIONAL LEVEL
Previous findings noted an almost 44% decrease in PM10 and an 8% decrease in PM2.5. Approximately, 44% and 32 % reduction in NOX and CO were recorded in the city of New Delhi on June 17, 2020, the day of the Janta curfew. The reason for this sharp decline in pollution levels was the restrictions imposed on construction, transportation, and industrial activities. During the period of closure periods, the air quality index (AQI) levels in the National Capital Region (NCR) of New Delhi ranged from excellent–to– moderate (Central Pollution Control Board [CPCB]) [Table 1].11 Overall, there was a 43%, 31%, 18%, and 10% decrease in PM2.5, PM10, NO2, and CO, respectively. While SO2 concentrations showed location-specific variability, O3 revealed a 17% rise in concentration.8 Kolkata had a 24–45% drop in CO emissions due to reduced industrial emissions and transportation services during LD.12 In the Silicon Valley of Bengaluru, AQI was improved from the hazardous class after LD. In Mumbai and New Delhi, NO2 levels were dropped by around 40–50% during LD.13 Concentrations of PM were at their lowest level during the last two decades during the shutdown. Observation and evaluating how reduced emissions from different sources influenced the overall quality of the air was made possible by the LD. These kinds of research can assist us in the future in managing air pollution. Faridabad (47%) and Ghaziabad (22%) had significant drops in SO2 levels during the LD, whereas Gurugram (14%) and Noida (10%) saw just minor drops. O3 was observed, and responses were examined for the several LD stages (LD 1 from March 25 to April 14, 2020; LD 2 from April 15 to May 3, 2020; LD 3 from May 4 to 17, 2020; and LD 4 from May 18 to 31, 2020) as well as the before-LD (BLD) period (BLD from March 1 to 24, 2020).14 Data on the state of the air from March to May 2020 were compared to that from the same time in 2019. The NCR in India saw 78% of its cities successfully implement LDs, according to data gathered by the CPCB between March 16, 2020, and April 15, 2020.15 The above data make it clear that there has been a noticeable improvement in PM10, PM2.5, SO2, and NO2 levels. One possible explanation is the regional transfer of benzene and SO2 from thermal power plants.16 Near Faridabad, there were gas-fired power plants, resulting in the NO2 level there being slightly more than usual. The primary sources of PM10 concentrations were the suspension of road dust, local emissions, and building activity; however, Delhi could also be associated with traffic emissions and biomass-burning activities.17 The mean value of PM2.5 was found to be 2.8 times greater in the post-LD and pre-LD periods compared to the LD period, and the concentration of PM2.5 was estimated to be higher than its standard limit. Agricultural practices, vehicle exhaust emissions from vehicles, industry pollutants, traffic, and re-suspended dust on roadways were some of these reasons. Because all of these sectors closed, there was a decrease in air pollutants throughout the LD time.18
| Area | PM2.5(%) | PM10(%) | SO2(%) | NO2(%) | O3(%) |
|---|---|---|---|---|---|
| Delhi | 46 | 48 | 17 | 56 | 34 |
| Gurugram | 54 | 54 | 14 | 50 | 53 |
| Faridabad | 55 | 60 | 47 | 17 | 37 |
| Noida | 48 | 48 | 10 | 68 | 42 |
| Ghaziabad | 54 | 60 | 22 | 60 | 35 |
NCR: National capital region, PM: Particulate matter, SO2: Sulphur dioxide, NO2: Nitrogen dioxide, O3: Ozone. Source - Central Pollution Control Board
EFFECT OF LD ON AIR POLLUTION IN DELHI
During the LD, there was a noticeable drop in PM2.5, NO2, and PM10 levels because of the weather, the number of automobiles on the road, and the operation of solely required business equipment. Throughout the LD, the total decrease in PM2.5 was 46%, and a 50% reduction in PM10 levels. Comparable levels of PM10 and PM2.5 reduction mostly point to a decrease in industrial and combustion sources, which the two parts of particle matter share. Restrictions on vehicle activity resulted in a 56% decrease in NO2 and a more than 37% decrease in CO during the period of LD because the transport sector accounts for 81% of Delhi’s NOx emissions (TERI Emission Inventory, 2018) relative to the time before the shutdown. Forty-seven percent of the levels of benzene have been noticed after limits have been placed on the transportation industry and business activities, which are the two main producers of emissions of benzene. The fact that power plants in the Delhi area account for more than 70% of the city’s SO2 emissions (TERI emission inventory, 2018) and that these industries were operating throughout the LD may be the reason why only a 19% decrease in SO2 levels was observed. Over the course of the 22-day LD, for 20 and 15 days, respectively, the 24-hourly average of PM2.5 and PM10 was determined to be within the national ambient air quality standards. In contrast, the 24-hourly threshold of NO2 was 75% lower during this time. The lowest 24-hourly average values of PM10, PM2.5, NO2, and SO2 were 39 µg/m 3, 24 µg/m3, 15 µg/m 3, and 10 µg/m 3, respectively, for the duration of the LD. Compared to the first two weeks of the closure (March 25–April 6), there was a 27% increase in PM2.5 and a 65% increase in PM10 in the 2nd week of April (April 7– April 15). Even yet, PM2.5 and PM10 concentrations were still 39% and 35% lower, respectively, than they had been before the LD. The primary cause of this might be a shift in the weather. With the arrival of summer, the temperature has begun to rise, resulting in dry and dusty conditions. On March 16, 2020, the lowest and highest temperatures were 12.6°C and 27°C, respectively. On April 15, 2020, the temperature increased to 24°C and 40°C. In addition, A minor dust cyclone originating from the country’s west and the gulf regions was reported to have reached Delhi between April 14 and 15, which caused the NCR and Delhi to see a sharp increase in PM10 levels. These all data are shown in Figures 1-4, respectively.19

- The 24-hourly average particulate matter (PM) 2.5 comparison in Delhi and national capital region.
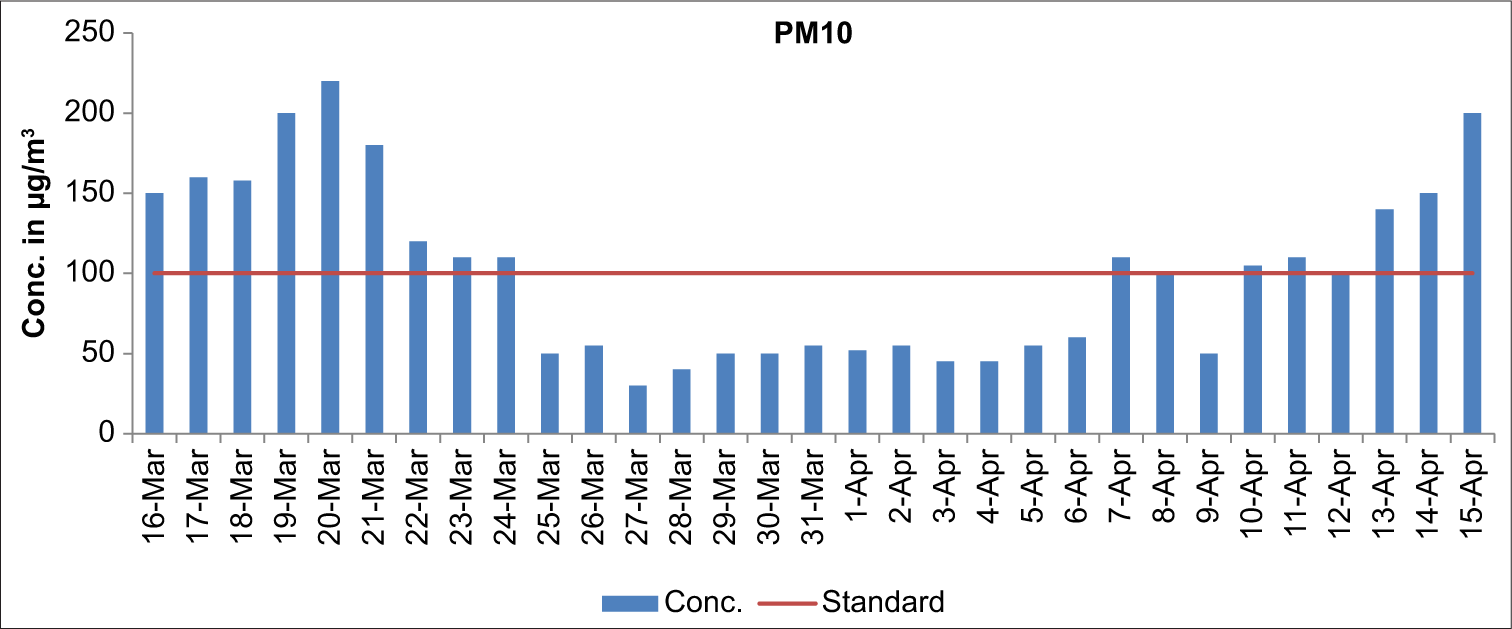
- The 24-hourly average particulate matter (PM) ten comparison in Delhi and national capital region.
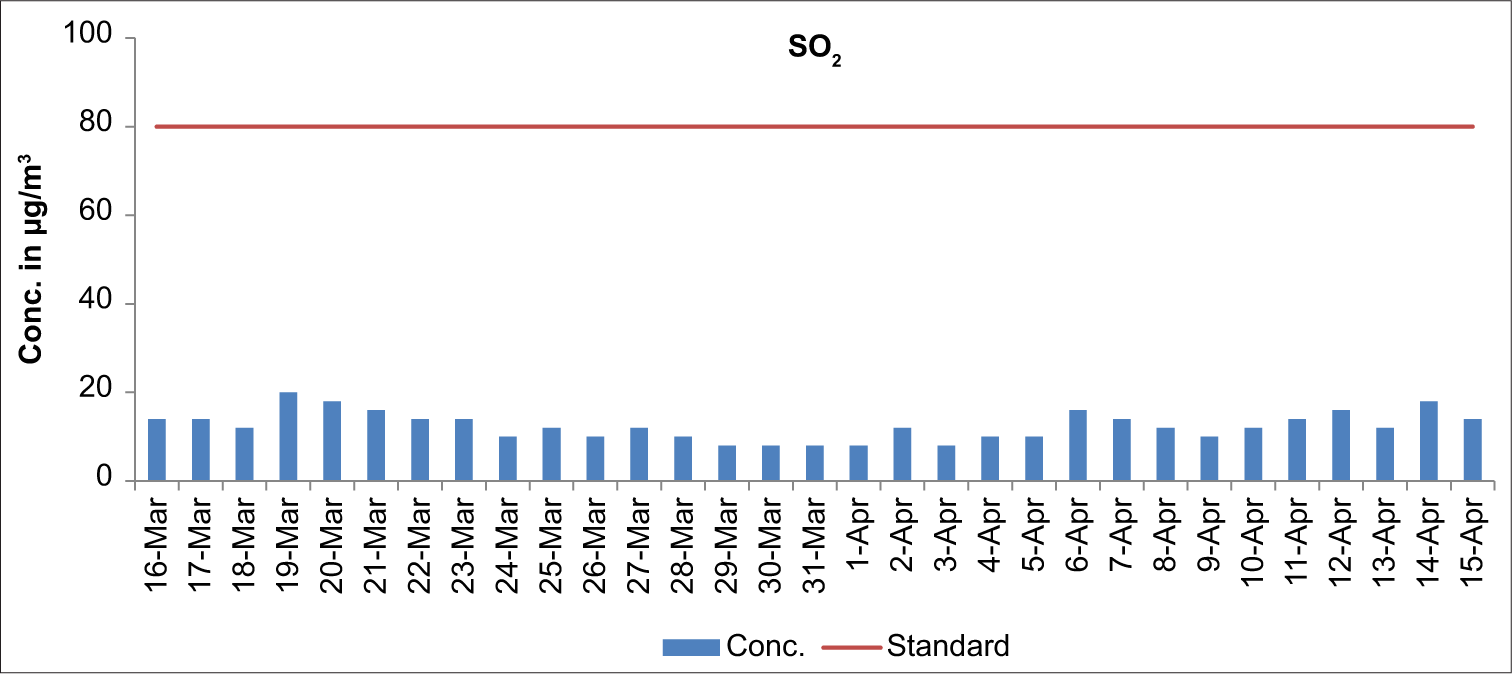
- The 24-hourly average sulfur dioxide (SO2) comparison in Delhi and national capital region.
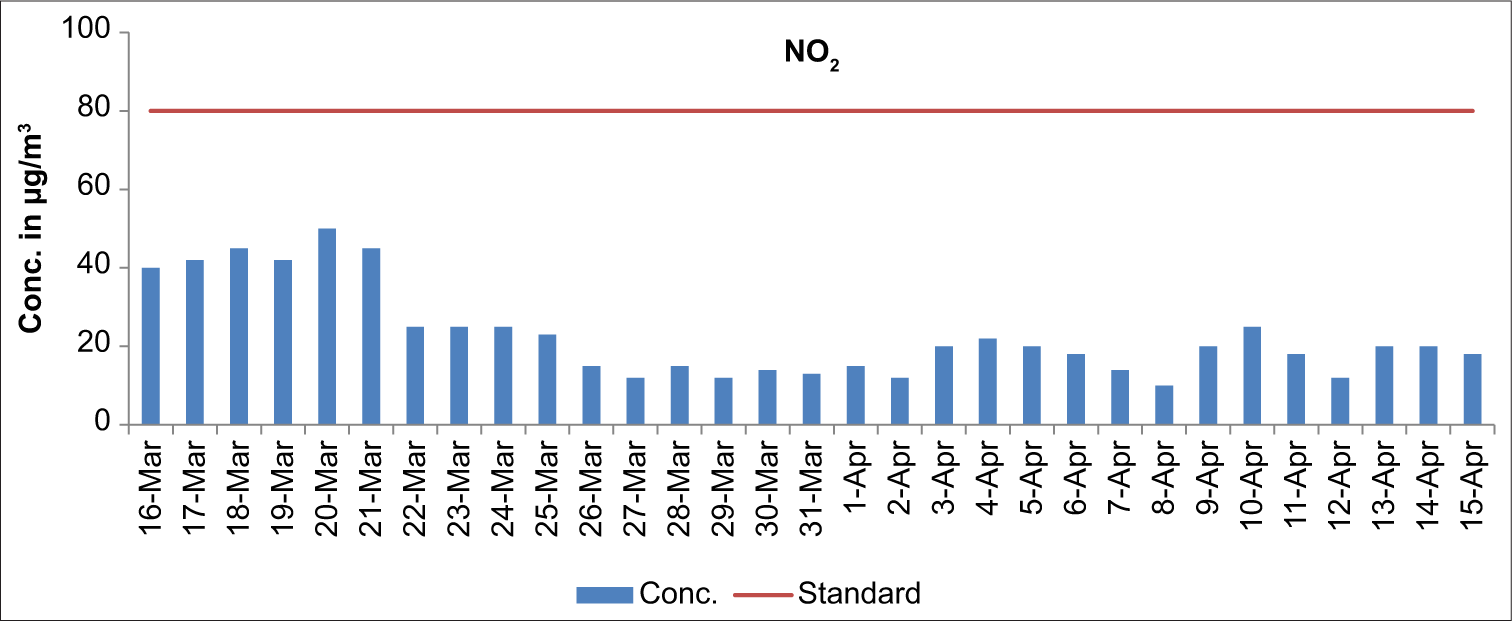
- The 24-hourly average nitrogen dioxide (NO2) comparison in Delhi and national capital region.
THE EFFECT OF METEOROLOGICAL PARAMETERS
The rate at which air pollutants such as O3, CO, NO2, SO2, and PM2.5 are removed is strongly correlated with the intensity of the rain, as rain scavenging is an essential phenomenon for this process.20 Neither a significant nor an occurrence of rainfall occurred throughout the LD study period. Wind speed and the surrounding temperature have a major role in how air pollutants disperse. When summer arrives during the LD season, the temperature rises, and atmospheric stability falls; this leads to an increase in mixing height and vertical mixing of air pollutants in the troposphere.21 The average temperature was raised by 1.3 times (6.8°C) during the post-LD period and by two times (13.5°C) during the pre-LD period. Strong solar radiation and an increase in global temperatures produced ground-level O3, which enhances the rate of photochemical reaction; this procedure gradually reduces the concentration of other contaminants. The concentration of air pollution decreased as a result of pollutant dispersion brought on by increased wind speeds during the LD period.22
EXAMINING THE AIR QUALITY THROUGH SATELLITE IMAGES
PM (PM2.5 and PM10) is one of the most important parameters of air quality, as PM2.5 can enter into our lungs and may cause harm to them. PM is emitted by burning fossil fuels, road-suspended dust particles, thermal power plants, and shelters made from burning fuel and other industry materials. A substantial decrease in PM levels was observed during the COVID-19 pandemic. [Figure 5] Elevated PM negatively impacts human health by deteriorating air quality, resulting in premature mortality, lung cancer, and cardiopulmonary illness.22 There is a notable reduction in particle matter in the Delhi NCR area, which is the center of air pollution.23

- Satellite image of levels of particulate matter (PM)2.5 and PM10 in Indian atmosphere (nullearth.com).
HEALTH EFFECT BY AIR POLLUTION
Any uncommon suspended particle in the air that interferes with an organ’s ability to operate normally is considered an air toxicant in terms of health risks. Based on the information that is now available, the respiratory, immunologic, ophthalmologic, dermatologic, cardiovascular, neuropsychiatric, hematologic, and reproductive systems are the primary targets of air pollution exposure.
Long-term, nevertheless, molecular and cell toxicity may potentially result in a number of malignancies.24 Conversely, it has been demonstrated that even minute concentrations of air toxicants pose a risk to vulnerable populations, such as children, the elderly, and those with respiratory and cardiovascular conditions.25 Air pollution is a significant environmental risk factor for a number of respiratory diseases, such as asthma and lung cancer.26 Air pollutants may seriously harm the respiratory system. This is especially the case with PMs and other respirable compounds, including dust, O3, and benzene.27 Air toxicant exposure can lead to the development of asthma, a respiratory illness.28
Several research investigations have confirmed links between elevated risk of Chronic Obstructive Pulmonary and air pollution from industry, transportation, and/or both.29 Several experimental and epidemiological studies have clearly shown a connection between air pollution exposure and heart-related illnesses.30 Air pollution has also been connected to changes in white blood cell numbers, which may have an impact on cardiovascular health. There is evidence connecting traffic-related air pollution, namely, exposure to high NO2 levels, to both left and right ventricular hypertrophy.31
CONCLUSION
People’s health is significantly impacted adversely by air pollution, especially in sub-Saharan Africa, South and East Asia, and the Western Pacific, where it may cause and exacerbate a number of diseases with high morbidity and fatalities. Reducing air pollution is, therefore, essential; this should be the primary focus of the government. All rules and regulations concerning air pollution have to be revised by the lawmakers and policymakers in these countries. Strong preservation of the environment organizations need to be in charge of coordinating efforts among various departments involved in air pollution. Sufficient funding for management, R&D, oversight, and complete environmental control — including air pollution — is essential for efficient environmental protection.
Ethical approval
Institutional Review Board approval is not required.
Declaration of patient consent
Patient’s consent not required as there are no patients in this study.
Conflicts of interest
There are no conflicts of interest.
Use of artificial intelligence (AI)-assisted technology for manuscript preparation
The authors confirm that there was no use of artificial intelligence (AI)-assisted technology for assisting in the writing or editing of the manuscript and no images were manipulated using AI.
Financial support and sponsorship
Nil.
References
- Environmental and Health Impacts of Air Pollution: A Review. Front Public Health. 2020;8:14.
- [CrossRef] [PubMed] [Google Scholar]
- Future Research Needs Associated with the Assessment of Potential Human Health Risks from Exposure to Toxic Ambient Air Pollutants. Environ Health Perspect. 1994;102:193-210.
- [CrossRef] [PubMed] [Google Scholar]
- Sustainable Development through Less Carbon Emission. Int J Green Chem. 2020;6:30-5.
- [Google Scholar]
- Effects of Meteorological Conditions and Air Pollution on COVID-19 Transmission: Evidence from 219 Chinese Cities. Sci Total Environ. 2020;741:140244.
- [CrossRef] [PubMed] [Google Scholar]
- Novel Coronavirus COVID-19: An Overview for Emergency Clinicians. Emerg Med Pract. 2020;22:1-21.
- [Google Scholar]
- The Coronavirus Response in India-World's Largest Lockdown. Am J Med Sci. 2020;360:742-8.
- [CrossRef] [PubMed] [Google Scholar]
- A Preliminary Analysis of Changes in Outdoor Air Quality in the City of Southampton during the 2020 COVID-19 Outbreak to Date: A Response to DEFRA's Call for Evidence 1 on Estimation of Changes in Air Pollution Emissions, Concentrations and Exposure during the COVID-19 Outbreak in the UK Southampton: University of Southampton; 2020.
- [Google Scholar]
- Effect of Restricted Emissions during COVID-19 on Air Quality in India. Sci Total Environ. 2020;728:138878.
- [CrossRef] [PubMed] [Google Scholar]
- The Impact of COVID-19 as a Necessary Evil on Air Pollution in India during the Lockdown. Environ Pollut. 2020;266:115080.
- [CrossRef] [PubMed] [Google Scholar]
- Available from: https://cpcb.nic.in/openpdffile.php/impact/of/lockdown (24th March) on air quality Anaual report 2019-20
- Impact of COVID-19 Related Shutdown on Atmospheric Carbon Dioxide Level in the City of Kolkata. Parana J Sci Educ. 2020;6:84-92.
- [Google Scholar]
- Comparative Study on Air Quality Status in Indian and Chinese Cities before and During the COVID-19 Lockdown Period. Air Qual Atmos Health. 2020;13:1167-78.
- [CrossRef] [PubMed] [Google Scholar]
- Impact of COVID-19: Global Environment, Indian Economy and Construction Sector. International Journal of Scientific and Research Publications. ;11:303-11.
- [CrossRef] [Google Scholar]
- Impact of Lockdown (25th March to 15th April) on Air Quality. Available from: https://cpcb.nic.in/openpdffile [Last accessed on 2023 Dec 22]
- [Google Scholar]
- Significant Changes in Urban Air Quality during Covid-19 Pandemic Lockdown in Rohtak City, India. Asian J Chem. 2022;34:3189-96.
- [CrossRef] [Google Scholar]
- Air Quality before and after COVID-19 Lockdown Phases around New Delhi, India. J Health Pollut. 2021;11:210602.
- [Google Scholar]
- Short Term Unwinding Lockdown Effects on Air Pollution. J Clean Prod. 2021;296:126514.
- [CrossRef] [Google Scholar]
- Available from: https://cpcb.nic.in/special-monitoring-data/impact/of/lockdown (25th March to 15th April)on air quality [Last accessed on 2021 Oct 04]
- Impact of COVID-19 Lockdown on Air Quality in Chandigarh, India: Understanding the Emission Sources during Controlled Anthropogenic Activities. Chemosphere. 2021;263:127978.
- [CrossRef] [PubMed] [Google Scholar]
- Real-time Monitoring of Air Pollutants in Seven Cities of North India during Crop Residue Burning and their Relationship with Meteorology and Transboundary Movement of Air. Sci Total Environ. 2019;690:717-29.
- [CrossRef] [PubMed] [Google Scholar]
- Diurnal and Temporal Changes in Air Pollution during COVID-19 Strict Lockdown Over Different Regions of India. Environ Pollut. 2020;266:115368.
- [CrossRef] [PubMed] [Google Scholar]
- Indirect Impact of COVID-19 on Environment: A Brief Study in Indian Context. Environ Res. 2020;188:109807.
- [CrossRef] [PubMed] [Google Scholar]
- Environmental Air Pollutants and the Risk of Cancer. Gan To Kagaku Ryoho. 2013;40:1441-5.
- [Google Scholar]
- Vulnerability to Air Pollution Health Effects. Int J Hyg Environ Health. 2008;211:326-36.
- [CrossRef] [PubMed] [Google Scholar]
- Effects of Long-term Exposure to Traffic-related Air Pollution on Respiratory and Cardiovascular Mortality in the Netherlands: The NLCS-AIR Study. Res Rep Health Eff Inst. 2009;139:5-71. discussion 73-89
- [Google Scholar]
- Pulmonary Oxidative Stress, Inflammation and Cancer: Respirable Particulate Matter, Fibrous Dusts and Ozone as Major Causes of Lung Carcinogenesis through Reactive Oxygen Species Mechanisms. Int J Environ Res Public Health. 2013;10:3886-907.
- [CrossRef] [PubMed] [Google Scholar]
- Ambient Air Toxics and Asthma Prevalence among a Representative Sample of US Kindergarten-age Children. PLoS One. 2013;8:e75176.
- [CrossRef] [PubMed] [Google Scholar]
- Outdoor Air Pollution and Respiratory Health in Asia. Respirology. 2011;16:1023-6.
- [CrossRef] [PubMed] [Google Scholar]
- Stroke and Long-term Exposure to Outdoor Air Pollution from Nitrogen Dioxide: A Cohort Study. Stroke. 2012;43:320-5.
- [CrossRef] [PubMed] [Google Scholar]
- Air Quality Monitoring and Measurement in an Urban Airshed: Contextualizing Datasets from the Detroit Michigan Area from 1952 to 2020. Sci Total Environ. 2022;809:152120.
- [CrossRef] [PubMed] [Google Scholar]