Translate this page into:
A Study on risk factors of Under-nutrition of under-five children in an urban area of Malda district, West Bengal
Address for correspondence: The Editor/ Managing Editor, Journal of Comprehensive Health, Dept of Community medicine, NRS Medical College, 138, AJC Bose Road, Kolkata-700014
Corresponding author: Subhadeep Guha, ¼ B Madan Baral Lane, Kolkata 70001 M-8584830933, email: pointersubho@gmail.com
Abstract
Introduction:
Under-nutrition is highly prevalent in developing countries including India. Many risk factors are responsible for the occurrence of under-nutrition. To understand area specific causes (risk factors) responsible for under-nutrition among under-five children in Malda town, a case control study was undertaken.
Methods:
Forty two cases with under-nutrition (weight for age <- 2SD) and 84 controls with normal weight (weight for age ≥ -2SD were selected from 6 ICDS centres in 1:2 ratio.
Results:
Of the selected cases, 22(52.4%) were moderately underweight and 20 (47.6%) were severely underweight; 57% were male & 43% were female children. 55% Mothers of severely underweight children were illiterate whereas 65% fathers of severely under-weight children were labourer. From bivariate analysis it was reflected that no statistical differences were there between underweight & normal weight children with respect to variables like family size, per capita family income, Maternal age at child birth, birth weight, breast feeding & its duration, diarrhoea and worm infestation(p>.05). Factors like fathers’ occupation, ARI (38.1% vs 17.8%), feeding problems (65% vs. 40.5%), incomplete vaccination (73.8% vs 39.3%) were associated with under-nutrition (P<.01). Undernourished children showed statistical association with angular stomatitis, conjunctival xerosis, bilateral oedema & severe wasting compared to normal nourished children. (p<.01).
Conclusion:
Factors like fathers’ occupation, ARI, feeding problems, incomplete vaccination were associated with under-nutrition of under-fives attending ICDS centres in an urban setting of Malda district, West Bengal.
Keywords
Under nutrition
Underweight
Under-five children
Urban

Introduction:
Malnutrition remains one of the most common causes of morbidity & mortality among children.[1] Nutritional status of children is an indicator of nutritional profile of entire community. Protein energy malnutrition affects every fourth child world-wide. Geographically, more than 70% of PEM children live in Asia.[2]
So far causes of under-nutrition is concerned, it is primarily due to (a) inadequate intake of food (food gap), both in quality & quantity, and (b) infections, e.g. diarrhoea, ARI, Measles, worm infestation etc. It acts as a vicious cycle – infection aggravating malnutrition and malnutrition aggravating infection. Other contributing factors include poor environment, large family size, inadequate breast feeding, less frequent feeding etc. [3] Strong predictors of child nutritional status in developing countries are place of residence, household wealth, birth weight, age of child, awareness regarding diarrheal disease and acute respiratory tract infection control, maternal education, and source of drinking water.[4]
In India, as per National Family Health Survey-3(NFHS-3), 45.9%, 19.1% & 38.4% children less than 3 years were underweight, wasted & stunted respectively. Only 46.3% infant under six month were found to be breastfed and 55.8% children age 6-9 months receiving solid or semi-solid food and breast milk.[5] Prevention & appropriate treatment of diarrhoea, measles and other infection in infancy & early childhood are important to reduce malnutrition rates.[3] Coverage evaluation survey done in India in 2009 revealed that only 61% children were fully immunized.[6] There is paucity of area specific data about the factors responsible for under-nutrition among under five children. Therefore, I undertook a case- control study to explore the factors responsible for under-nutrition in an urban setting of Malda districts of West Bengal.
Aims and objectives:
To study socio-demographic characteristics of the study population
To identify risk factors of under-nutrition of study population
Material and Methods:
Type of study:
Observational analytical study
Study design:
Case control
Study population:
Under-five children attending ICDS centres situated at Malda Municipal area
Sample size:
At 95% confidence level & 80% power, sample size is estimated to be 104 (42 cases & 82 control), when exposure rate of cases to at least one of the risk factors is presumed to be 50% with odds ratio 3. Cases will be selected at 1:2 ratios with control.
Selection criteria:
Selection of cases:
under five children attending ICDS centres currently with underweight (moderate or severe, plotted on yellow or red zone of ICDS growth charts) will be taken as cases
Selection of Control:
Under five children attending ICDS centres currently with normal weight (plotted on green zone of ICDS growth charts) will be taken as control. For Each case, 2 controls will be taken.
Matching:
Matching will be done with respect to age & ICDS centres (Control will be selected from same centre, wherefrom cases are selected)
Instruments used:
Interview schedule, Salter's weighing machines, Infanto-meter & stadio-meter
Data collection procedures:
Six ICDS centres were selected randomly from the list of ICDS centres in the said municipal area. From each centres 7 under-weight & 14 normal weight children were taken. Weekly visit was made to each selected centre to select one case & two age matched control, thus in 7 weeks (within stipulated time of 8 weeks) data collection was complete. Mothers attending with their children were briefed up about my work and consent was sought to participate. After consent was taken, necessary data regarding socio-demographic characteristics, other explanatory variables like feeding, episode of illness, birth weight, immunization status etc. were collected with help of a predesigned & pre-tested interview schedule. Anthropometric measurements like weight and height/length were measured. Weight was taken with salter's weighing machine. For younger age group mini salter's weighing machine was used. Up to 2 years age, infanto-meter for measuring length and above 2 years, stadio-meter for measurement of height was used.
Quality control:
Selected data were checked by faculty member of community medicine, Malda Medical College, Malda to ensure quality.
Confidentiality:
Data, thus collected, were strictly kept confidential
Plan of analysis/ statistical tools:
Data were entered in Ms Excel sheet & Epi info 7 was used for statistical analysis. Proportion of different variables like feeding problem, immunization coverage etc and mean weight & height (with SD) were calculated. Exposure rate & Odds ratio with respect to different risk factors were estimated. For test of significance chi square & t test were used & p value less than .05 was taken as statistically significant.
Ethical considerations:
Necessary approval was taken from institutional ethics committee of Malda Medical College, Malda
Results:
42 under-five children with under-weight as per WHO growth standard (weight for age) were chosen as cases from 6 selected ICDS centres of Malda Municipality, of them 52.4% were moderately underweight and 47.6% were severely underweight; 57% of cases were male and 43% female children. For each case 2 controls with normal weight were selected from the same ICDS centres. Among 84 controls, 46.4% & 53.6% were male & female children respectively. Average height/length of moderately underweight, severely underweight & normal weight children were 81.3, 81.9 & 80.1 CM respectively with no statistical difference. 47.6% of underweight and 44% normal weight children belonged to nuclear family. 55% Mothers of severely underweight children were illiterate, whereas proportion of illiterate mothers of moderately underweight and normal weight children were 32% & 30% respectively. Proportion of graduate father (9.5%) of normal weight children were more compared to under-nutrition group (2.4%). Most of the mothers of both study and control group were house makers whereas 65% of fathers of severely underweight children were labourer, proportion were higher as compared to moderately under-weight & normal weight group. (Table-1, Figure:1)
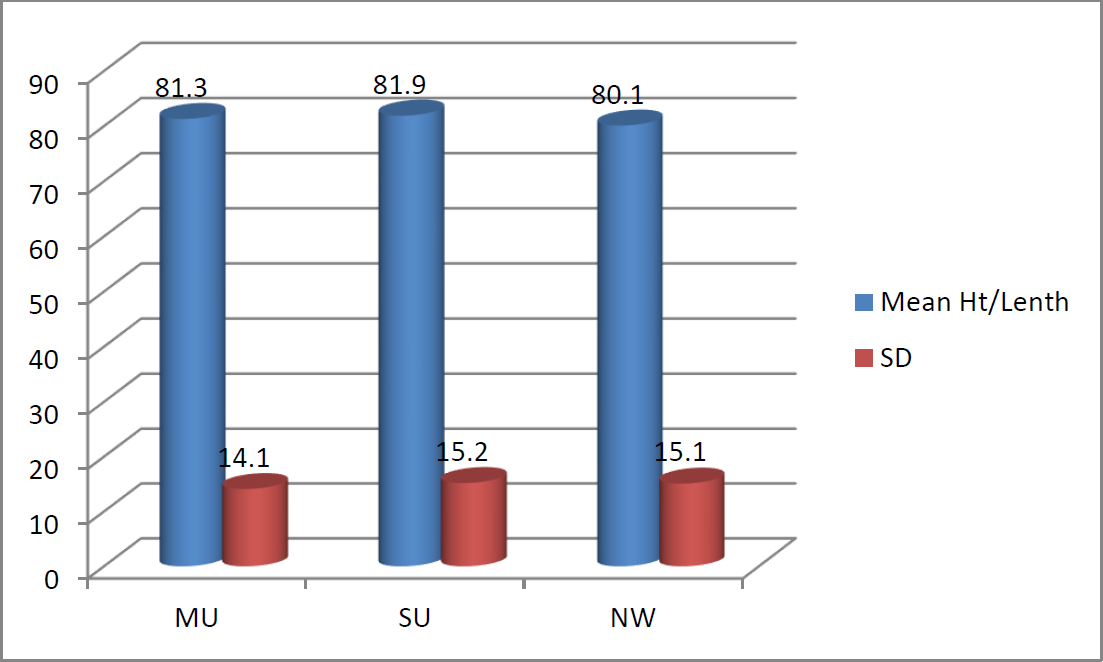
- Mean height/Length (CM) & SD among under-weight & normal weight children
| Socio-demographic characteristics | Case (n=42) | Control (n=84) No (%) | ||
|---|---|---|---|---|
| Moderately underweight No (%) | Severely underweight No (%) | |||
| Age | 0-12 | 4(18.2) | 1(5.0) | 11(13.1) |
| 12-24 | 3(13.6) | 3(15.0) | 19(22.6) | |
| 24-36 | 6(27.3) | 7(35.0) | 24(28.6) | |
| 36-48 | 6(27.3) | 4(20.0) | 19(22.6) | |
| 48-60 | 3(13.6) | 5(25.0) | 11(13.1) | |
| Sex | Male | 14(63.6) | 10(50.0) | 39(46.4) |
| Female | 8 (36.4) | 10(50.0) | 45(53.6) | |
| Family type | Nuclear | 9(40.9) | 11(55.0) | 37(44.0) |
| Joint | 9(40.9) | 2 (10.0) | 33(39.3) | |
| 3rd Generation | 4(18.2) | 7 (35.0) | 14(16.7) | |
| Education of Mother | Illiterate | 7(31.8) | 11(55.0) | 25(29.8) |
| Primary | 5(22.7) | 6 (30.0) | 26(30.9) | |
| Secondary | 8 (36.4) | 3(15.0) | 22(26.2) | |
| HS | 2(9.1) | 0(0.0) | 6 (7.1) | |
| Graduate/Diploma | 0(0.0) | 0(0.0) | 5 (5.9) | |
| Education of father | Illiterate | 7(31.8) | 5(25.0) | 22(26.2) |
| Primary | 8(36.4) | 7(19.1) | 16(35.0) | |
| Secondary | 3(13.6) | 7(35.0) | 24(28.6) | |
| HS | 3(13.6) | 1(5.0) | 14(16.7) | |
| Graduate/Diploma | 1(4.5) | 0(0.0) | 8(9.5) | |
| Occupation of Mother | Service | 3(13.6) | 4(20.0) | 7(8.3) |
| Homemaker | 18(81.8) | 13(65.0) | 71(84.5) | |
| Self employed | 1(4.6) | 3(15.0) | 6(7.1) | |
| Occupation of Father | Service | 11(50.0) | 2(10.0) | 31(36.9) |
| Labour | 8(36.4) | 13(65.0) | 23(27.4) | |
| Self employed | 3(13.6) | 5(25.0) | 30(35.7) | |
| X2=14.67, p=.005 | ||||
Average numbers of family members of case and control group were 5.7 and 5.9 respectively with no statistical difference. Odds of higher income groups compared with lower income group varied from 1.8 to 2.7, but difference was not statistically significant. Mothers aged above 20 have about 2.5 times more chance of having underweight children compared with mothers aged below 20 years. Analysis showed that those having low birth weight had 1.4 times more chance of developing under-nutrition, but statistical test did not agree. Children of primi-mothers and Children with preceding birth interval >=3 have less chance to be undernourished. Only 4 children (2 cases & 2 controls) did not breastfeed at all. Only 9.5% children took mothers’ milk for less than 6 moths, whereas 45% cases & 55% control were currently breastfed. 48% of under-fives of both the groups were exclusively breastfed for 6 months. Proportion of EBF for 0 to 5 months was 12-13% only, whereas practice to give EBF for more than 6 months was rather high (about 40%). Feeding problems in form of less frequent and inadequate feeding was found high among severely under-weight children (65%) compared to moderately underweight (31.8%) & normal weight children (40.5%). Odds 2.7 indicated that the chance of developing severe under-weight among children with feeding problem was 2.7 times more than that among children without feeding problem. About 74% of under-weight and 39% normal weight children have incomplete vaccination; difference was statistically significant (p=.0002). Children with incomplete immunization were 4.35 times more associated with under-nutrition than children with complete immunization appropriate for their age. Almost equal proportion of children (20.5% normal weight and 19% underweight) suffered from episode of diarrhoea during last 2 months(p=.84), whereas about 38% underweight and 18% normal weight children suffered from episode of ARI in last 2 months(p=.01). More than 40% under-fives in both the groups have current history of expulsion of worm, which were found more among severely underweight children (55%). (Table-2)
| Variables | Case (n=42) Underweight(<-2 SD) |
Control (n=84) No (%) |
OR | χ2 p |
|||
|---|---|---|---|---|---|---|---|
| Moderately underweight (<-2 SD to > -3SD) No (%) |
Severely underweight (< -3SD) No (%) |
Total No (%) |
|||||
| Family size | <4 | 6(27.2) | 7(35.0) | 13(31.0) | 25(29.7) | .014 .9 |
|
| 5-6 | 8(36.4) | 7(35.0) | 15(35.7) | 35(41.7) | .82 | ||
| >6 | 8(36.4) | 6(30.0) | 14(33.3) | 24(28.6) | .12 | ||
| Per capita monthly income | <1000 | 3(14.3) | 2(10.5) | 5(12.5) | 20(26.7) | .75 .38 |
|
| 1000-2000 | 16(76.2) | 14(73.7) | 30(75.0) | 44(58.7) | 2.7 | ||
| >2000 | 2(9.5) | 3(15.8) | 5(12.5) | 11(14.6) | 1.8 | ||
| Maternal age at child birth | <20 | 1(5.3) | 1(5.9) | 2(5.5) | 10(13.2) | .398 .5 |
|
| 20-25 | 16(84.2) | 13(76.5) | 29(80.6) | 56(73.6) | 2.59 | ||
| >25 | 2(10.6) | 3(17.6) | 5(13.9) | 10(13.2) | 2.5 | ||
| Birth weight | Normal | 7(41.2) | 10(50.0) | 17(45.9) | 26(44.8) | .77 .38 |
|
| Low | 10(58.8) | 10(50.0) | 20(54.1) | 32(55.2) | 1.4 | ||
| Birth interval | < 3 years | 10(45.4) | 10(50.0) | 20(47.6) | 31(42.0) | 1.91 .38 |
|
| >=3 years | 5(22.7) | 7(35.0) | 12(28.6) | 21(15.9) | 88 | ||
| Not applicable | 7(31.8) | 3(15.0) | 10(23.8) | 29(42.0) | .53 | ||
| Breast feeding | Yes | 22(100.0) | 18(90.0) | 40(95.2) | 82(97.6) | .7 .4 |
|
| No | 0(0.0) | 2(10.0) | 2(4.8) | 2(2.4) | 4.1 | ||
| Duration of breast feeding | <6 month | 2(9.1) | 2(10.0) | 4(9.5) | 8(9.5) | .17 .67 |
|
| 6-12 month | 2(9.1) | 1(5.0) | 3(7.1) | 9(10.7) | .7 | ||
| >12 month | 7(31.8) | 9(45.0) | 16(38.2) | 21(25.0) | 1.5 | ||
| Currently breastfed | 11(50.0) | 8(40.0) | 19(45.2) | 46(54.8) | .8 | ||
| Duration of EBF (in month) | 0-5 | 3(13.6) | 2(10.0) | 5(11.9) | 11(13.1) | .002 .96 |
|
| 6 | 12(54.6) | 8(40.0) | 20(47.6) | 40(47.6) | 1.1 | ||
| >6 | 7(31.8) | 10(50.0) | 17(40.5) | 33(39.3) | 1.13 | ||
| Current feeding practice | No feeding problem | 15(68.2) | 7(35.0) | 22(52.4) | 50(59.5) | .5 .4 (3.9, .04*) |
|
| Feeding problem | 7(31.8) | 13(65.0) | 20(47.6) | 34(40.5) | 1.33 (2.7*) | ||
| Immunization Status | Complete | 5(22.7) | 6(30.0) | 11(26.2) | 51(60.7) | 13.35 .0002 |
|
| Incomplete | 17(77.3) | 14(70.0) | 31(73.8) | 33(39.3) | 4.35 | ||
| Diarrhoea in last 2 months | Yes | 2(9.1) | 6(30.0) | 8(19.0) | 17(20.5) | .91 | .04 .84 |
| No | 20(90.9) | 14(70.0) | 34(81.0) | 66(79.5) | |||
| ARI in last 2 months | Yes | 9 (40.9) | 7(35.0) | 16(38.1) | 15(17.8) | 2.8 | 6.18 .01 |
| No | 13(59.1) | 13(65.0) | 26(61.9) | 69(82.1) | |||
| Worm infestation | Yes | 8(36.4) | 11(55.0) | 19(45.2) | 36(42.9) | 1.1 | .06 .80 |
| No | 14(63.6) | 9(45.0) | 23(54.8) | 48(57.1) | |||
*Severely under-weight vs. normal weight children
Associated nutritional deficiencies found out on clinical examination in underweight children were angular stomatitis, glossitis, Bitot's spot, bilateral oedema & severe wasting. 55% of severely underweight children and 27% moderately underweight children showed angular stomatitis. In comparison with normal weight children, difference was statistically significant (p=.0001). Similar finding was evident for conjunctival xerosis. 40 % of severe underweight and about 23% moderately underweight children have signs of vitamin A deficiency. Compared with normal weight children, difference was significant. Severe underweight was found to be associated with 40% bilateral oedema & 50% severe wasting. In comparison with the normal weight & moderately underweight difference was statistically significant (p<.01) (Table-3) One fourth of the study subjects both in cases and controls showed delayed developmental milestone. (Fig: 2)
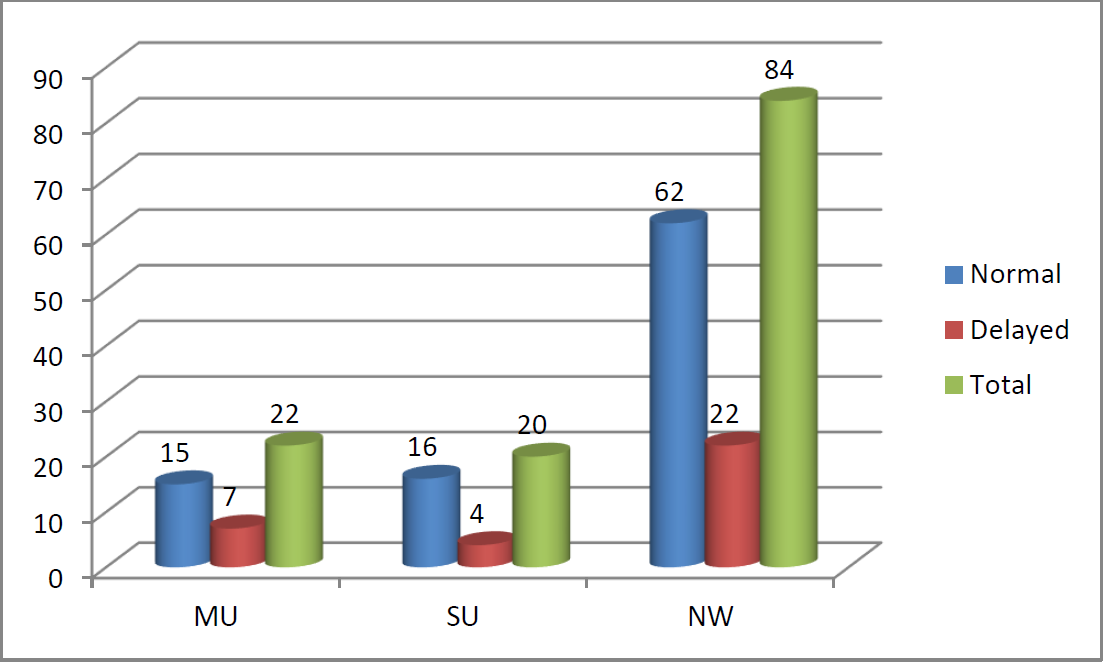
- Developmental milestone in cases and controls
| Nutritional Deficiency signs | Case (n=42) | Control (n=84) No (%) | ||
|---|---|---|---|---|
| Moderately underweight No (%) | Severely underweight No (%) | |||
| Angular stomatitis | Yes | 6(27.3) | 11(55.0) | 10(11.9) |
| No | 16(72.7) | 9(45.0) | 74(88.1) | |
| χ2=18.359, p=0.0001 | ||||
| Glossitis | Yes | 4(18.2) | 2(10.0) | 11(13.1) |
| No | 18(81.8) | 18(90.0) | 73(86.9) | |
| χ2=.64, p=.73 | ||||
| Conjunctival xerosis | Yes | 5(22.7) | 8(40.0) | 6(7.1) |
| No | 17(77.3) | 12(60.0) | 78(92.9) | |
| χ2=14.8, p=0.0006 | ||||
| Bilateral Oedema | Yes | 1(4.5) | 8(40.0) | 2(2.4) |
| No | 21(95.5) | 12(60.0) | 82(97.6) | |
| χ2=29.27, p=0.0000 | ||||
| Severe Wasting | Yes | 7(31.8) | 10(50.0) | 2(2.4) |
| No | 15(68.2) | 10(50.0) | 82(97.6) | |
| χ2=34.4, p=.0000 | ||||
Discussion:
To explore the risk factor associated with under-nutrition among children below 5 years in a urban setting of Malda district, West Bengal, a case control study was carried out with 42 cases with weight for ages <-2SD and 84 control with normal weight selected from 6 randomly chosen ICDS centres located under English Bazar Municipality of Malda town. Matching was made with respect to ICDS centres and age group, so that they become comparable. Among the cases 52.4% were moderately underweight and 47.6% were severely underweight; 57% of cases were male and 43% female children. 55% Mothers of severely underweight children were illiterate, whereas proportion of illiterate mothers of moderately underweight and normal weight children were 32% & 30% respectively. Similar findings were documented in different studies conducted in India & abroad, where mother's illiteracy was shown to be contributing factors to under-nutrition of children.[9,11,13,16,17] In current study it was found that proportion of graduate father (9.5%) of normal weight children were more compared to under-nutrition group (2.4%), but in terms of absolute number it did make no sense. In a case control study carried out in Ethiopia showed father's education as determinants of nutritional status of under-five children.[8,17] Most of the mothers of both study and control group were house makers. 65% of fathers of severely underweight children were labourer, proportion were higher as compared to moderately under-weight & normal weight group (p=.005). Though in current study no statistical relationship of under-nutrition was found with mothers’ occupation and per capita monthly income, several studies conducted elsewhere established that parents’ occupation & income contributed to nutrition status of the offspring.[9,13,14,16,17,19,20]
Average numbers of family members of case and control group were 5.7 and 5.9 respectively with no statistical difference. In a hospital based study[11] conducted in Pakistan found maternal age of 28.6 % of the malnourished children was < 20 years, unlike the findings of current study, where only 2 mothers (4.8%) of cases were below 20 years. In our study 54% underweight children were low birth weight. This finding corroborated the result in the study conducted in Mangalore showing higher proportion of underweight among children with low birth weight.[15] Children of primi- mothers and Children with preceding birth interval >=3 have less chance to be undernourished. This result complied with the findings in the study conducted in Nepal showing gap more than two year between two pregnancies positively related with child health and nutrition.[14]
48% of under-fives of both the groups were exclusively breastfed for 6 months. Proportion of EBF for 0 to 5 months was 12-13% only, whereas practice to give EBF for more than 6 months was rather high (about 40%). As both the group consumed mothers’ milk in good number, no statistical difference was found. Study conducted in Mangalore showed similar trend where exclusive breast-feeding was not found a significant correlate of nutritional status[15]; but elsewhere correlation between breast feeding & nutritional status of under-fives was revealed.[14] Feeding problems in form of less frequent and inadequate feeding was found high among severely under-weight children (65%) compared to moderately underweight (31.8%) & normal weight children (40.5%).(p=.04). It corroborated the fact that food gap was important predictor of under-weight.[3,14] Children with incomplete immunization were 4.35 times more associated with under-nutrition than children with complete immunization appropriate for their age.(p=.0002). This finding matched with the result of the study conducted elsewhere.[12,14] A hospital based study done in Pakistan showed that 2l % of the malnourished children was not immunized against eight EPI (Expanded Program on Immunization) target diseases .[12] In our study, under-nutrition was found to be associated with episodes of ARI in last 2 months, but no such association was established with episode of diarrhoea or worm infestation. In the case control study conducted in Ethiopia[8], diarrhoea was found to associated with under-nutrition, whereas another study conducted in Gujarat found out ARI in last 2 weeks to be significantly associated with wasting.[19] In the current study, it was found that under-weight was highly associated with angular stomatitis, conjunctival xerosis, bilateral oedema and severe wasting, but no such association was found with developmental milestones.
Conclusion:
Childhood under-nutrition is multifactorial disorder. Bi-variate analysis in the current study reflected that the factors like fathers’ occupation, ARI, feeding problems, incomplete vaccination were associated with under-nutrition of under-fives attending ICDS centres in an urban setting of Malda district, West Bengal.
Suggestions:
Emphasis needs to be given by the health and ICDS workers on timely completion of vaccination, counselling of care givers on infant & young child feeding with appropriate food according to age, as well as prompt & skilled management of ARI
Acknowledgement:
Authors are thankful to the Indian Council of Medical research (ICMR) for approval & support to the project as SHORT TERM STUDENTSHIP (STS). We express our sincere thanks to the ICDS Workers (AWW) & mothers of under-five children of English Bazar Municipality, Malda for their cooperation.
References:
- family Welfare, Government of India, New Delhi. Facility based IMNCI (F- IMNCI) Participants Module 2009
- [Google Scholar]
- Park's Text Book of Preventive & Social Medicine. (22nd). Jabalpur (MP): M/s Banarsidas Bhanot publishing; 2011. p. :506-590. 830-32
- [Google Scholar]
- Malnutrition among under-five children in India and strategies for control. http://www.ncbi .nlm.nih.gov/pmc/articles/PMC4367032/ (accessed )
- [CrossRef] [PubMed] [Google Scholar]
- Health Policies and Programmes in India. (11th). Delhi: Doctors Publications publishing; p. :49.
- [Google Scholar]
- Directorate of Health services, Government of West Bengal. Health on the March :2012-13.
- [Google Scholar]
- Assessment of Factors Associated with Malnutrition among Under Five Years Age Children at Machakel Woreda, Northwest Ethiopia: A Case Control Study. J Nutr Food Sci. 2014;4:1.
- [CrossRef] [Google Scholar]
- Assessment of nutritional status of under five children in Akure south local government, Ondo state, Nigeria. IJRRAS. 2013;14(3) http://www.arpapress.com/Volumes/Vol14Issue3/IJRRAS143 24.pdf, (accessed )
- [Google Scholar]
- Assessment of nutritional status of 1–5 year old children in an urban union council of Abbottabad. J Ayub Med Coll Abbottabad. 2010;22(3) http://www.ayubmed.edu.pk/JAMC/PAST/22-3/Hassam.pdf (accessed )
- [Google Scholar]
- Malnutrition amongst under-five years children in Swat, Pakistan: Prevalence and Risk Factors. Tropical Journal of Pharmaceutical Research August. 2014;13(8):1367-1370. http://www.tipr.org/vol13 no8/201413824.pdf. (accessed )
- [CrossRef] [Google Scholar]
- Malnutrition among children under five years in district Sanghar, Sindh, Pakistan. Gomal Journal of Medical Sciences. 2015;13(1):54-57.
- [Google Scholar]
- Under-nutrition status of children under 5 years in Chinese rural areas - data from the National Rural Children Growth Standard Survey, 2006. Asia Pac J Clin Nutr. 2011;20(4):584-592.
- [Google Scholar]
- Nutritional status of under five year children and factors associated in Kapilvastu District, Nepal. Symbiosis http://www.symbiosisonlinepublishing.com/nutritionalhealth-foodscience/nutritionalhealth-foodscience06.pdf (accessed )
- [Google Scholar]
- Prevalence and risk factors of under nutrition among under five children in a rural community. Nitte University Journal of Health Science. 2013;3(4):82-86.
- [Google Scholar]
- A study on assessment of nutritional and immunization status of under-five children in urban slums of Jamnagar city, Gujarat. healthline. 2013;4(2) pISSN 2239-337X337X/eISSN 2320-1525 (accessed )
- [Google Scholar]
- Assessment of Nutritional Status of under-five year rural children in the Districts of Madhya Pradesh State. 2011
- [Google Scholar]
- Assessment of Nutritional Status of Rural Anganwadi Children of Aligarh under the ICDS (Integrated Child Development Services) and Rural Health. Stud Home Com Sci. 2012;6(2):95-98.
- [CrossRef] [Google Scholar]
- Prevalence of Under Nutrition in 0-5 Year Children of Junagadh District, Gujarat. http://dspace.sctimst.ac.in/i spui/bitstre am/123456789/2132/1/MPH 6149.pdf. (accessed )
- [Google Scholar]
- Gender inequality in nutritional status among under five children in a village in Hooghly district, West Bengal. Indian J Public Health. 2008;52:218-20.
- [Google Scholar]
- A Comparison Between z Scores and the Conventional System. ICAN: Infant, Child, & Adolescent Nutrition; 2014.
- [Google Scholar]