Translate this page into:
Workplace Noise Exposure and Relative Health Hazardous Among the Power Loom Workers – A Cross-Sectional Study

*Corresponding author: Somnath Sen, Division of Environmental Health, ICMR-Centre for Ageing and Mental Health, Kolkata, West Bengal, India. somnathnioh@gmail.com
-
Received: ,
Accepted: ,
How to cite this article: Sen S, Ravichandran B, Karunamoorthy P. Workplace Noise Exposure and Relative Health Hazardous Among the Power Loom Workers – A Cross-Sectional Study. J Compr Health. doi: 10.25259/JCH_58_2024
Abstract
Background
Exposure to excessive noise in the workplace is a potential risk, and higher noise levels with longer exposure can lead to increased noise-induced hearing loss (NIHL). Furthermore, noise exposure is the second most common risk factor in the workplace, after workplace injuries in an occupational exposure setting.
Objectives
The objective of this study was to find out the prevalence of NIHL among the workers in the power loom industry.
Material and Methods
This cross-sectional study was carried out at a home-based small-scale weaving factory (power looms) located in Bangalore city to find out the occupational noise exposure and NIHL during the year 2019–2020. Noise exposure monitoring was carried out in 12 power loom workplace areas using a portable integrated sound level meter along with frequency spectra bands. A total of 172 (122 male and 50 women) workers took part in the study. An audiometric test was carried out among the workers along with personal details and lifestyle factors with a predesigned questionnaire.
Results
Noise monitoring was conducted at power looms to evaluate the exposure assessment. It was found that the study population was highly exposed to noise with a full shift noise exposure of 95.7dB(A). The mean ranges of Leq and TWA in this study were 92.3–100.2 dB(A) and 84.4–95.9 dB(A), respectively. The octave band analysis of noise of high sound levels with the frequencies of 1000 Hz, 2000 Hz, and 4000 Hz was carried out, and the highest sound intensity was recorded in 2000 Hz frequency followed by 4000 Hz above 90dB(A) in both frequencies. The audiometry test was conducted on 69 workers (60 men and 9 women) who voluntarily participated in the pure-tone audiometry. Out of 69 workers, 60 (87%) of the study group suffered from noise-induced hearing loss.
Conclusion
The study was conducted in an unorganized sector where high noise in the power looms may be the use of machines without any shielding with soundproof materials/barriers from the workplace. The inadequate acoustic design and poor machinery maintenance may also be a reason. This study elucidates the trends in the burden and risk of hearing loss among workers in hazardous noise environments.
Keywords
Power loom
Noise exposure
Spectrum band
Noise-induced hearing loss

INTRODUCTION WITH OBJECTIVES
Sound is an integral part of our everyday lives, but when it turns into noise, it can cause adverse effects on our health. Exposure to excessive noise in the workplace is a potential risk, and higher noise levels with longer exposure can lead to increased [Noise-Induced Hearing Loss (NIHL)]. Factories are the source of industrial noise pollution, which can affect both the people who work there and the nearby residents. Depending on the industrial noise’s frequency, amplitude, and range, it might either just irritate workers or people nearby, or it can disrupt speech and hearing, often leading to permanent hearing loss. Over 450 million people (over 5% of the world’s population) are suffering from disabling hearing loss,1 and workplace noise has a major input NIHL.1 NIHL is considered one of the most prevalent work-related diseases worldwide, affecting more than 10% of all workers in developed countries.2 A recent systematic review from China estimated a prevalence of 21.3% for occupational NIHL in noise-exposed Chinese workers over the past 26 years.3 In the USA, 25% of workers reported a history of occupational noise exposure, with a point prevalence of 14%.4,5 As per the 2015 European Survey on Working Conditions, 28% of European workers reported being exposed to loud noise during at least one-fourth of their working time, with the percentage ranging from 18% to 44%.6
NIHL occurs because excessive noise damages the delicate hearing mechanism of the inner ear. Initially, the excessive noise causes a temporary hearing loss or temporary threshold shift, and the hearing recovers to normal over a while. Other effects, such as sleep disturbance, are significant, and, in some instances, noise can even provoke changes in social behavior.7
Exposure to noise has an effect on the cardiovascular system and an increase in blood pressure (BP). As noise surges, stress hormones such as cortisol, epinephrine, and nonepinephrine may later be the causes of the onset of high BP, heart stroke, and heart failure.8 Chronic exposure to noise has been associated with cardiovascular disease, including ischemic heart disease,9 myocardial infarction,10,11 coronary heart disease,12,13 and stroke.14 This association may exist because noise exposure activates the sympathetic and endocrine systems to affect the humoral and metabolic states of the human organism, producing the increase in BP and the changes in other biological risk factors (such as blood lipids and glucose levels) that promote the development of hypertension and cardiovascular diseases. Prolonged exposure to noise levels ≥85 dB(A) may increase males’ systolic and diastolic BP (DBP) levels, and this association may translate into a higher incidence of hypertension.15
The extent of noise pollution is increasing rapidly in our country with the expansion of a wide range of industries and changes in lifestyle. Considering other pollutants, many workers are exposed to a high level of occupational and environmental noise both in organized and informal sectors. Excessive noise pollution has been blamed not only for hearing damage and community annoyance but also for hypertension, fatigue, heart trouble, and biochemical changes, and workers are not aware of the adverse effects of noise except NIHL. Therefore, to examine noise exposure in the workplace, a cross-sectional study was conducted among the workers at the power loom to find out the prevalence of NIHL,” both in the abstract and the main manuscript.
MATERIAL AND METHODS
Study subjects
A cross-sectional study was carried out among 172 power loom workers who were exposed to continuous noise at the workplace during the year 2019–2020. It was a 1-year study, and all the eligible workers who consented to the study were included in the analysis. Thus, a complete enumeration method was followed, and no sampling was done. A walk-through survey was conducted in weaving power looms located in the Yelahanka region of Bangalore city, which is one of the power loom cluster areas in the state of Karnataka, India. The ethical clearance was obtained from the Institutional Ethics Committee. The weaving looms in this area solely operated in the unorganized or informal sector on a home basis. It was found that the noise in the workrooms of weaving looms was louder, and the intensity was also transmitted to the surrounding locality where the workers were living with their families. The workers had to talk loudly to someone 1 m away in the workplace. On the basis of this criterion, 11 (11 Nos.) weaving looms were approved, enabling us to perform the study and collect the necessary data. The inclusion criteria were as follows: The selected workers were employed for at least 1 year; they had healthy lifestyles before they entered this occupation; and the selected subjects had not routinely been exposed to other chemical or physical factors associated with hypertension (e.g., solvents, heat), had no medical factors or diseases that could affect BP, have no family history of hypertension, and have no habit of using hearing protection.
Questionnaire
With pre-tested, structured questionnaires were prepared, and face-to-face interviews were conducted with each subject. The information collected in the questionnaire included demographic characteristics, lifestyle habits (smoking and alcohol consumption), work history, physical and chemical factor exposure (including noise exposure), disease history, family history of hypertension, informed consent, and other data. All the volunteers were interviewed and before collecting the personal information, the written consent was obtained.
Measurement of noise
The noise level measurements were carried out using a portable integrated sound level meter (SLM) (3M™ “SoundPro™ SLM SE/DL-1-1/3,” USA). The instrument was calibrated daily using a calibrator. To monitor the exposure level of sound in the workplace, the equivalent noise level (Leq – is the preferred method to describe sound levels that vary over time, resulting in a single decibel value that takes into account the total sound energy over the period) and time-weighted average (TWA – averaged to an 8-h workday) were monitored over working hours in the factory premises. It was held at arm’s length and roughly 1–1.5 m above the ground when recording data to prevent the operator and other objects from absorbing noise. The direction of the SLM was toward the nearby noisy source. The sound pressure level in weighing scale “A” and the noise spectrum were recorded continuously during the entire working shift, and data were stored in SLM.
Determination of BP
The American Heart Association’s guidelines for measuring BP were followed.16 In short, a pre-calibrated digital sphygmomanometer (OMRON HEM-7113, Omron HealthCare, Kyoto, Japan) was used to test the worker’s BP while making sure they were comfortable. Every subject was assessed 3 times, with a 3–5 min gap between each assessment. The study took into account the average of the second and third measurements. It measures heart rate and BP and displays the results digitally. Accuracy: +3 mmHg of pressure BP was measured in a silent, private room while the subject was seated following a brief time of rest for 10 min. Systolic BP of at least 140 mmHg and/or a DBP of at least 90 mmHg were considered to be the outcome (high BP). Regardless of the measured BP level, any employee who reported using anti-hypertensive medication was categorized as having hypertension.16
Audiometric test
In an audiometric room, the hearing threshold was assessed at various frequencies. The audiometry test was conducted after the personnel received an explanation of it. A qualified audiologist technician assisted in the field setting for the administration of the audiometric exam. For eight frequencies, notably 0.25, 0.5, 1.0, 2.0, 3.0, 4.0, 6.0, and 8.0 kHz, data were individually gathered for each ear. Three categories of frequency (low, mid, and high) were used to determine the hearing impairment. Out of 172 workers, 69 employees (60 men and nine women) voluntarily participated in the pure-tone audiometry.
Statistical analysis
The Statistical Package for the Social Sciences (SPSS) statistical software (version 21, IBM, SPSS Inc.) was used to analyze the data. To evaluate categorical data, a two-sided Pearson’s Chi-square (χ2) test was used. Continuous data were checked for normality distribution. Normally distributed data were presented in mean and standard deviation, while skewed data were presented in median and interquartile range. The difference between the two groups was compared by independent-sample two-sided Student’s t-test (normal distribution) and Mann–Whitney U-test (skewed distribution). P ≤ 0.05 was deemed statistically significant, and all tests were conducted in a two-sided manner.
RESULTS
Characteristics of gasoline station workers
This study examines the level of noise exposure, demographic profiles, and work-related habits of power loom workers. One hundred and seventy-two noise-exposed workers (122 men and 50 women; mean age of the male workers 38.33 ± 9.75 years and women workers 35.82 ± 9.19 years, mean exposure history = 10.89 ± 8.96 years of male and 9.48 ± 7.85 years for women) participated in this study. The educational status of most of the workers was up to the primary level (69.7% male and 74% female). The male workers having the habit of smoking were 18%, and alcohol intake was 14% of the total study population. The average BP of the male workers was 129.50/78.72 mmHg, with a heart rate of 70.32 beats per minute (BPM). For females, the BP was 125.45/77.88 mmHg, and the heart rate was 68.44 BPM. The average body mass index of workers was 24.67 ± 4.27 for males and 24.42 ± 5.97 for women. Male workers had pre-diabetic levels of random blood sugar (141.12 ± 68.98 mg/dL). However, women workers had lower RBS levels (130.48 ± 38.29 mg/dL) [Table 1].
| Variables | Male No. (%) | Female No. (%) | Statistical test (P-value) |
|---|---|---|---|
| Sex | 122 (70.9) | 50 (29.1) | 1.458# (0.139) |
| Age (Years) Mean±SD | 38.33±9.75 | 35.82±9.19 | 0.422# (0.674) |
| Educational status | |||
| Primary | 85 (69.7) | 37 (74) | 0.422# (0.674) |
| Upper primary to >10 | 32 (26.2) | 11 (22) | |
| 10+ | 5 (4.1) | 02 (4) | |
| Smoking | |||
| Yes | 22 | 0 | −5.164# (0.001) * |
| No | 100 | 50 | |
| Alcohol intake | |||
| Yes | 17 | 0 | −9.510# (0.001) * |
| No | 105 | 50 | |
| Work experience (years) median [IQR] | 9.00 [4.00–17.25] | 8.00 [3.00–15.00] | 1.032$ (0.305) |
| SBP (mm Hg) Mean±SD | 129.50±20.47 | 125.45±19.72 | 1.232+ (0.221) |
| DBP (mm Hg) Mean±SD | 78.72±12.48 | 77.88±11.13 | 0.426+ (0.671) |
| Heart Rate (BPM) Mean±SD | 82.61±11.81 | 88.16±11.69 | −2.811+ (0.006)* |
| Weight (kg) Mean±SD | 65.21±11.06 | 57.85±11.39 | 3.872+ (0.001)* |
| Height (m) Mean±SD | 1.63±0.07 | 1.64±0.84 | −0.102+ (0.919) |
| BMI (kg/m2) Mean±SD | 24.67±4.27 | 24.42±5.97 | 0.268+ (0.790) |
| RBS (mg/dL) Mean±SD | 141.12±68.98 | 130.48±38.29 | 1.227+ (0.204) |
Noise exposure monitoring
Noise monitoring was conducted in nineteen places at eleven weaving looms to evaluate the exposure assessment study. It was found that the study population was highly exposed to noise with a full shift noise exposure of 95.7dB(A). The results of the overall noise level at all the power looms are shown in Table 2, and the mean range of Leq and TWA in this study is 92.3–100.2 dB(A) and 84.4–95.9 dB(A), respectively. The maximum value reached for sound pressure was 129.5 dB(A) at Power loom-1 in location-3 and also exceeded the limit of 90 dB (A) recommended by the Occupational Safety and Health Administration (OSHA) and the Indian Factories Act, 1948. The details of Leq, L10, L90, TWA, Lmin, Lmax, and Lpk values are also shown in Table 2.
| Power loom | Location | Sampling h | Leq | L10 | L90 | TWA | LMin | LMax | LPK |
|---|---|---|---|---|---|---|---|---|---|
| PL-1 | Location-1 | 4.00 | 92.6 | 94.6 | 89.5 | 89.6 | 48.8 | 97.2 | 122.3 |
| Location-2 | 1.20 | 92.3 | 96.0 | 80.3 | 84.4 | 44.8 | 97.4 | 124.7 | |
| Location-3 | 2.00 | 95.1 | 96.8 | 91.1 | 89.1 | 79.6 | 98.3 | 129.5 | |
| PL-2 | Location-1 | 7.30 | 95.9 | 97.4 | 93.3 | 95.9 | 86.1 | 101.8 | 118.5 |
| PL-3 | Location-1 | 5.30 | 95.0 | 97.4 | 89.3 | 93.4 | 58.4 | 101.5 | 122.4 |
| Location-2 | 2.00 | 96.1 | 97.9 | 92.2 | 90.1 | 56.4 | 99.4 | 122.1 | |
| PL-4 | Location-1 | 4.00 | 95.9 | 97.3 | 93.8 | 93.1 | 88.5 | 110.7 | 126.3 |
| Location-2 | 3.00 | 94.1 | 89.9 | 91.0 | 91.0 | 81.5 | 110.5 | 128.2 | |
| PL-5 | Location-1 | 4.00 | 94.7 | 97.6 | 78.9 | 91.9 | 47.3 | 99.1 | 119.3 |
| PL-6 | Location-1 | 2.20 | 96.0 | 98.4 | 91.7 | 90.7 | 51.2 | 109.9 | 126.6 |
| Location-2 | 1.55 | 95.4 | 98.3 | 88.7 | 89.2 | 50.4 | 100.1 | 120.7 | |
| Location-2 | 2.21 | 95.7 | 98.4 | 90.5 | 90.4 | 80.9 | 100.3 | 124.4 | |
| PL-7 | Location-1 | 2.36 | 98.9 | 101.0 | 67.6 | 94.0 | 48.6 | 102 | 124.0 |
| Location-2 | 2.15 | 100.2 | 101.2 | 98.6 | 94.7 | 88.7 | 102 | 120.1 | |
| PL-8 | Location-1 | 7.00 | 95.9 | 98.3 | 91.9 | 95.4 | 56.5 | 101.3 | 120.3 |
| Location-2 | 6.00 | 97.5 | 99.1 | 93.7 | 96.2 | 70.5 | 100.4 | 124.7 | |
| PL-9 | Location-1 | 7.00 | 94.0 | 96.7 | 61.4 | 93.4 | 50.8 | 98.9 | 120.9 |
| PL-10 | Location-1 | 5.00 | 96.0 | 98.4 | 91.8 | 93.8 | 35.3 | 100.4 | 122.0 |
| PL-11 | Location-1 | 5.16 | 96.9 | 98.8 | 92.6 | 95.1 | 55.4 | 102.5 | 121.2 |
| Mean | 95.7 | 97.6 | 87.8 | 92.2 | 62.1 | 101.8 | 123.1 | ||
| SD | 1.9 | 2.4 | 9.4 | 3.0 | 17.0 | 4.1 | 3.0 | ||
| Min | 92.3 | 89.9 | 61.4 | 84.4 | 35.3 | 97.2 | 118.5 | ||
| Max | 100.2 | 101.2 | 98.6 | 96.2 | 88.7 | 110.7 | 129.5 |
Leq is the average sound pressure level during a period of time, L10 value is the level just exceeded for 10% of the time and takes account of any annoying peaks of noise, L90 describes the level which was exceeded for 90% of the time, TWA-The 8-h time-weighted average sound level (TWA), LMax-highest and LMin -lowest values measured by the sound level meter over a given period, LPK is the maximum value reached by the sound pressure, PL-Power Loom, SD-Standard Deviation
Spectrum analysis
The octave band analysis of noise of high sound levels with frequencies of 1000 Hz, 2000 Hz, and 4000 Hz in the loom’s areas is shown in Figure 1. The high level of sound present in this frequency range may cause NIHL in workers. The highest sound intensity was recorded at 2000 Hz frequency, followed by 4000 Hz. The sound levels were above 90dB(A) in both frequencies.
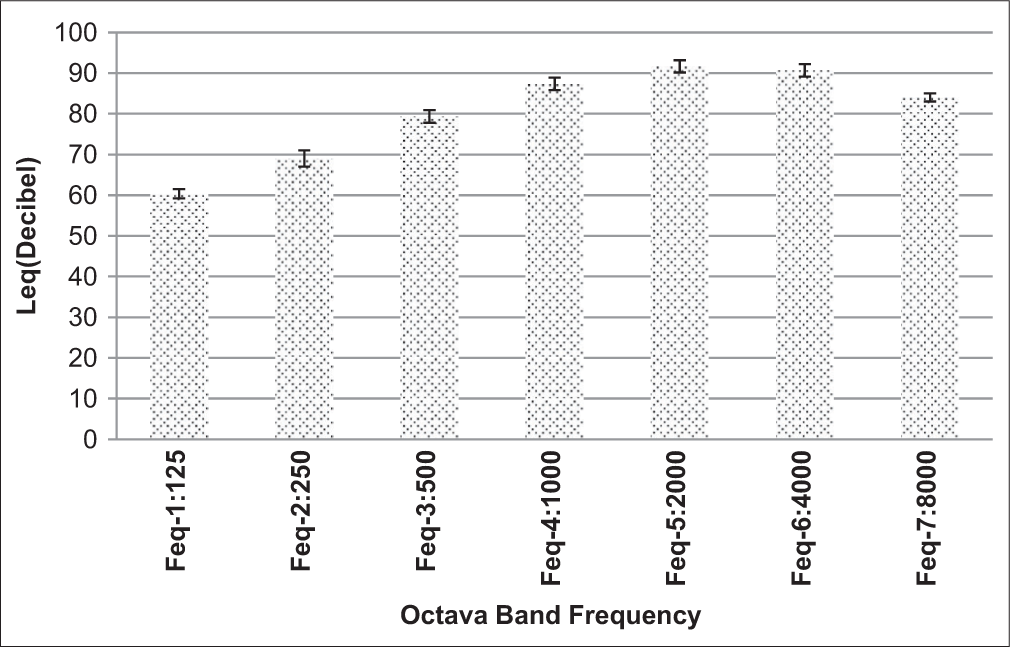
- Results of octave band analysis in weaving plants.
NIHL among the power loom workers
The audiometry test was conducted on 69 workers (60 men and nine women) who voluntarily participated in the pure tone audiometry. Out of 69 workers, 60 (87%) of the study group suffered from noise-induced hearing loss. Table 3 shows the NHIL results among the work in the power looms. The overall incidence of hearing impairment across the 69 workers, categorized by age groups, indicates that 75% of individuals aged 19–25 experience mild NIHL, with no cases of bilateral or severe hearing loss reported. In the 26–30 age bracket, 88.89% of participants also displayed mild and bilateral NIHL.
| Age group (Years) | Total no. of workers examines (n=69) | No. of NIHL | Percentage | Loss of dB (A) | ||||
|---|---|---|---|---|---|---|---|---|
| Severity | Total | LFL | 4K Notch | HFL | ||||
| 19–25 | 4 | 3 | 75.00 | Mild | 3 | 1 | 2 | - |
| Bilateral | 0 | - | - | - | ||||
| Severe | 0 | - | - | - | ||||
| 26–30 | 9 | 8 | 88.89 | Mild | 4 | - | 3 | 1 |
| Bilateral | 4 | - | 4 | - | ||||
| Severe | 0 | - | - | - | ||||
| 31–35 | 11 | 10 | 90.91 | Mild | 5 | 1 | 2 | 2 |
| Bilateral | 4 | - | 4 | - | ||||
| Severe | 1 | - | - | 1 | ||||
| 36–40 | 20 | 17 | 85.00 | Mild | 4 | 1 | 3 | - |
| Bilateral | 13 | - | 12 | 1 | ||||
| Severe | 0 | - | - | - | ||||
| 41–45 | 14 | 11 | 78.57 | Mild | 2 | - | 2 | - |
| Bilateral | 8 | - | 7 | 1 | ||||
| Severe | 1 | - | - | 1 | ||||
| 46–50 | 6 | 6 | 100.00 | Mild | 3 | - | 3 | - |
| Bilateral | 2 | - | 2 | - | ||||
| Severe | 1 | - | 1 | - | ||||
| >56 | 5 | 5 | 100.00 | Mild | 0 | - | - | - |
| Bilateral | 5 | 1 | 3 | 1 | ||||
| Severe | 0 | - | - | - | ||||
| Total | 69 | 60 | 87 | 04 | 48 | 8 | ||
LFL: Low-frequency loss, HFL: High-frequency loss, NIHL: Noise-induced hearing , dB:Decibel
A total of 60 workers having NIHL out of 69 were examined. Among the 48 power loom workers had a mild 4 kHz notch. In the low frequency loss (LFL) band, three have mild NIHL and one has bilateral NIHL. In contrast with high frequency loss (HFL), three people have mild loss, three have bilateral loss, and two have severe hearing loss. In the 4 kHz notch, 15 workers had mild hearing loss, 32 had bilateral hearing loss, and one had severe hearing loss.
DISCUSSION
Exposure to hazardous noise levels above the permissible levels may have both auditory and non-auditory consequences. Noise exposure is the second most common risk factor in the workplace after workplace injuries in occupational exposure settings, and it contributes to 22% of workplace-related health issues.17 According to the WHO predictions, if no action is taken, there will be 630 million people living with debilitating hearing loss by 2030, with the figure expected to rise to more than 900 million by 2050.17 Many studies show that occupational noise exposure directly results in hearing loss with rates varying in the different regions, ranging from 7% to 21%.18-24
All the exposed workers were taken power loom workplace, where the highest level of noise was detected by SLM. Noise level (TWA) at the workplace ranged between 84.4 dB(A) and 96.2 dB(A) with a mean 92.2 dB(A), exceeding the level recommended by the Factories Act, 1948 (90 dB(A)), as well as exceeding the highest permissible level of occupational noise recommended by the international standards organization (OSHA) and American Conference of Governmental Industrial Hygienists which is 90 and 85 dB(A) for 8 h/day, respectively. These findings agreed with a study conducted in the textile industry that reported the highest level of noise in the spinning and weaving sectors, ranging from 80 dB(A) to 109 dB (A). None of the exposed workers used personal protective equipment during work shifts, which may be interpreted by the lack of awareness of the noise hazards and the importance of the protective devices’ use.
NIHL can be unilateral or bilateral, affecting both ears and causing transient or permanent hearing deficits. The severity depends on cellular damage and sound intensity. NIHL can result in permanent hearing loss and negatively impact an individual’s quality of life and the economy and society.24 In the present study, workers were exposed to 8 h noise intensity by 92.2 ± 3.0 dB(A), and 69.56% of workers were with NIHL at 4 kHz notch. Workers in industries, the military, ships, heavy machinery, weapons, and the aviation sector who are constantly exposed to noisy environments face a significant challenge with occupational NIHL. 4 kHz notch often known as noise trauma. Human hearing is more sensitive between 1 kHz and 5 kHz, which explains the pattern of irreversible hearing loss caused by noise-induced hearing damage with a 4 kHz notch. The study carried out by Zein-Elabedein et al. (2023)20 on occupational noise exposure in the textile industry in Egypt found out 91.7% had NHIL among workers, and out of 47.2% mild, 30.6% moderate, and 13.9% moderate-severe which was similar to our findings (87% having NIHL). A cross-sectional survey was conducted among textile workers of six textile factories in Karachi, Pakistan; 79% of workers had hearing impairment on audiometric assessment.17 The study Zein-Elabedein et al.20 included 145 workers who were exposed to hazardous levels of noise at a textile factory in Egypt, and showed sensorineural hearing loss (73.8%). Sensorineural hearing loss was mild in 63 (43.44%) ears, moderate in 82 (56.55%) ears, and severe in 69 (47.58%) ears. A cross-sectional descriptive study conducted at Textile Mill, Myanmar, found that 25.7% had hearing loss and 74.3% were normal. Among the workers with hearing loss, 48.3% had hearing loss on both sides, 31% on the right side, and 20.7% on the left side.21 Study was conducted by Abraham et al. (2019), the prevalence of NIHL was found to be 58.5%. Of 155 workers with NIHL, 101 (67.7%) were males.19 A cross-sectional survey carried out of the textile industry in China showed that the average NIHL was 51.4%, with HFL% and SFL% among workers, which were 64.2% and 5.6%, respectively.25 All of this research demonstrates that NIHL is still present in learning environments related to the textile industry worldwide. The study had limitations, including limited participant numbers, an unorganized sector, and a small sample size of the power loom industry. This may affect statistical efficiency, but the results can still influence hearing loss and risk factors. This study had several limitations. The number of participants in some types of work recruited in this study may result in limited numbers of certain categories after grouping by variables, which may affect the statistical efficiency of some analyses. Therefore, we grouped kurtosis less than some similar studies to reduce the impact of this limitation, and the results can still basically draw its influence on hearing loss and its risk factors. In addition, the majority of participants in this study were young men, whose exposure duration might be shorter than elder workers. As a result, the representativeness of the sample in the manufacturing industry might be insufficient. Another limitation of this study was that it included only a limited number of industries and types of work, which may be slightly under-represented in the broad range of noise types in different manufacturing industries. More participants from various industries, including more types of work, should be recruited in future studies to improve representation.
CONCLUSION
The study was conducted in an unorganized sector, where plant owners are not under a statutory agency, making monitoring and subject acquisition challenging. Second, the exposure levels continued from the surrounding power loom as their workplace weaving loom was in the residential complex in household basic, and the noise level was higher than prescribed by various statutory agencies. The reason for the high noise in the weaving looms may be the use of machines without any shielding with soundproof materials/barriers from the workplace. The inadequate acoustic design and poor machinery maintenance may also be a reason. This study elucidates the trends in the burden and risk of hearing loss among workers in hazardous noise environments. Efforts to reduce both the burden and risk are needed. Furthermore, suitable interventions and measures may be taken to reduce noise exposure at weaving looms and to protect workers from NIHL. As this industry falls under the small-scale industry category, awareness among workers and owners of such weaving looms is necessary.
Acknowledgement
The authors are appreciative to the Director of the National Institute of Occupational Health for allowing them to perform the research. We’d like to express our gratitude to the rest of the ROHC(S) team for their expert technical assistance. We would also like to thank the management and employees of power loom owners for their assistance in conducting this research.
Ethical approval
The research/study approved by the Institutional Review Board at ICMR-Regional Occupational Health Center (Southern), number ROHC(S)/2015/4, dated July 15, 2015.
Declaration of patient consent
The authors certify that they have obtained all appropriate patient consent.
Conflicts of interest
There are no conflicts of interest.
Use of artificial intelligence (AI)-assisted technology for manuscript preparation
The authors confirm that there was no use of artificial intelligence (AI)-assisted technology for assisting in the writing or editing of the manuscript and no images were manipulated using AI.
Financial support and sponsorship: Nil.
References
- Deafness and Hearing Loss. Available from: https://www.who.int/news-room/fact-sheets/detail/deafness-and-hearing-loss [Last accessed on 2022 Sep 27]
- [Google Scholar]
- Genetic Studies on Noise-induced Hearing Loss: A Review. Ear Hear. 2009;30:151-9.
- [CrossRef] [PubMed] [Google Scholar]
- Occupational Noise-induced Hearing Loss in China: A Systematic Review and Meta-analysis. BMJ Open. 2020;10:e039576.
- [CrossRef] [PubMed] [Google Scholar]
- Exposure to Hazardous Workplace Noise and Use of Hearing Protection Devices among US Workers--NHANES, 1999-2004. Am J Ind Med. 2009;52:358-71.
- [CrossRef] [PubMed] [Google Scholar]
- Workplace Noise Exposure and the Prevalence and 10-year Incidence of Age-related Hearing Loss. PLoS One. 2021;16:e0255356.
- [CrossRef] [PubMed] [Google Scholar]
- Burden of Disease from Burden of Disease From Geneva: World Health Organization; 2011. p. :126.
- [Google Scholar]
- Temporary and Permanent Noise-induced Threshold Shifts: A Review of Basic and Clinical Observations. Otol Neurotol. 2016;37:e271-5.
- [CrossRef] [PubMed] [Google Scholar]
- The Effect of Occupational Exposure to Noise on Ischaemic Heart Disease, Stroke and Hypertension: A Systematic Review and Meta-analysis from the WHO/ILO Joint Estimates of the Work-Related Burden of Disease and Injury. Environ Int. 2021;154:106387.
- [CrossRef] [PubMed] [Google Scholar]
- Occupational Exposure to Noise and Mortality from Acute Myocardial Infarction. Epidemiology. 2005;16:25-32.
- [CrossRef] [PubMed] [Google Scholar]
- Environmental Long-term Exposure to Road Traffic Noise and Incident Myocardial Infarction. Environmental Epidemiology. 2021;5(3):e148.
- [CrossRef] [PubMed] [Google Scholar]
- Noise Burden and the Risk of Myocardial Infarction: False Interpretation of Results due to Inadequate Treatment of Data. Eur Heart J. 2006;27:623-4. author reply 624
- [CrossRef] [PubMed] [Google Scholar]
- Long-term Effect of Occupational Noise on the Risk of Coronary Heart Disease. Scand J Work Environ Health. 2005;31:291-9.
- [CrossRef] [PubMed] [Google Scholar]
- Road Traffic Noise and Stroke: A Prospective Cohort Study. Eur Heart J. 2011;32:737-44.
- [CrossRef] [PubMed] [Google Scholar]
- The Noise/Stress Concept, Risk Assessment and Research Needs. Noise Health. 2002;4:1-11.
- [Google Scholar]
- Noise Exposure and Hypertension: Investigation of a Silent Relationship. BMC Public Health. 2015;15:328.
- [CrossRef] [PubMed] [Google Scholar]
- Measurement of Blood Pressure in Humans: A Scientific Statement from the American Heart Association. Hypertension. 2019;73:e35-66.
- [CrossRef] [Google Scholar]
- Addressing the Rising Prevalence of Hearing Loss Geneva: World Health Organization; 2018.
- [Google Scholar]
- Noise Induced Hearing Loss among an Occupational Group of Textile Workers in Karachi, Pakistan. Occup Med Health Aff. 2018;6:282.
- [CrossRef] [PubMed] [Google Scholar]
- Prevalence of Noise-Induced Hearing Loss among Textile Industry Workers in Dares Salaam, Tanzania. Ann Glob Health. 2019;85:85.
- [CrossRef] [PubMed] [Google Scholar]
- Association between Occupational Noise-induced Hearing Loss and Genotoxicity among Textile Factory Workers. Egypt J Otolaryngol. 2023;39:179.
- [CrossRef] [Google Scholar]
- Noise-induced Hearing Loss among Workers in Textile Factory. Egypt J Otolaryngol. 2014;30:243-8.
- [CrossRef] [Google Scholar]
- Assessment of Noise Exposure and Hearing Loss Among Workers in Textile Mill (Thamine), Myanmar: A Cross-Sectional Study. Saf Health Work. 2020;11:199-206.
- [CrossRef] [PubMed] [Google Scholar]
- The Global Burden of Occupational Noise-induced Hearing Loss. Am J Ind Med. 2005;48:446-58.
- [CrossRef] [PubMed] [Google Scholar]
- Epidemiological Characteristics of Hearing Loss Associated with Noise Temporal Structure among Manufacturing Workers. Front Integr Neurosci. 2022;16:978213.
- [CrossRef] [PubMed] [Google Scholar]